Fibrolamellar Hepatocellular Carcinoma (FLC)

FLC is a rare liver cancer of adolescents and young adults. In 2014 it was found that every FLC patient has a single change in their DNA: A deletion that results in fusing two genes together (Honeyman et al., 2014). One piece is from DNAJB1 (a heat shock protein co-factor) and one piece is from the catalytic subunit of protein kinase A (a kinase is a protein that modifies many other molecules in the cell, thus, it has many effects). This produces a mutant protein, a fusion called DNAJB1::PRKACA. Like the fire-breathing hybrid monster from Greek mythological monster, we call this a chimera. There are no other recurrent changes in the genome (Darcy et al., 2015). Since then we have learned that creating the same deletion in mice produces an FLC tumor (Engelholm et al., 2017; Kastenhuber et al., 2017), and expressing the DNAJB1::PRKACA chimeric protein (without the deletion) is sufficient to produce the tumor in mouse liver (Kastenhuber et al., 2017) or in primary human hepatocytes (Shirani et al., 2024) (one of the main liver cell types).

Some studies have examined the changes in the gene expression (known as the transcriptome) (Francisco et al., 2022; Hirsch et al., 2020; Robinson et al., 2017; Simon et al., 2015; Sorenson et al., 2017; Xu et al., 2015), or expression of proteins (Levin et al., 2023). However, comparing results from different labs is not straightforward. Moreover, we found little overlap across datasets (Requena et al., 2024). Our goal was to ask: “Can we reconcile the results from different labs?”. We wanted to be able to ask questions like:

  • “Are there consistent changes in FLC, or it a mixture of many different diseases?”
  • “What does FLC have in common with other liver tumors and what makes it different?”

First, we needed to resolve: Were the differences between labs the result of different analytic methods, or is there that much variability? We downloaded all of the available sequencing data and analyzed it with a uniform approach. First, we had to verify and curate the data. We found that in some of the published records FLC tissue listed as tumor was normal tissue and some tumor listed as normal was actually FLC. We found that some had submitted multiple copies of the sequences from a single patient. This could skew the results.

In the end we analyzed 220 verified samples, using a uniform state-of-the-art methodology of analysis (Requena et al. 2024). This includes samples with:

  • The chimeric fusion of the genes DNAJB1 and PRKACA in hepatocytes.

But also “FLC-like” samples:

  • Tumors missing activity of the R1 regulatory subunit of PKA (PRKAR1A) in hepatocytes.
  • Tumors expressing the chimeric fusion of the genes ATP1B1 and PRKACA in cholangiocytes.
Datasets

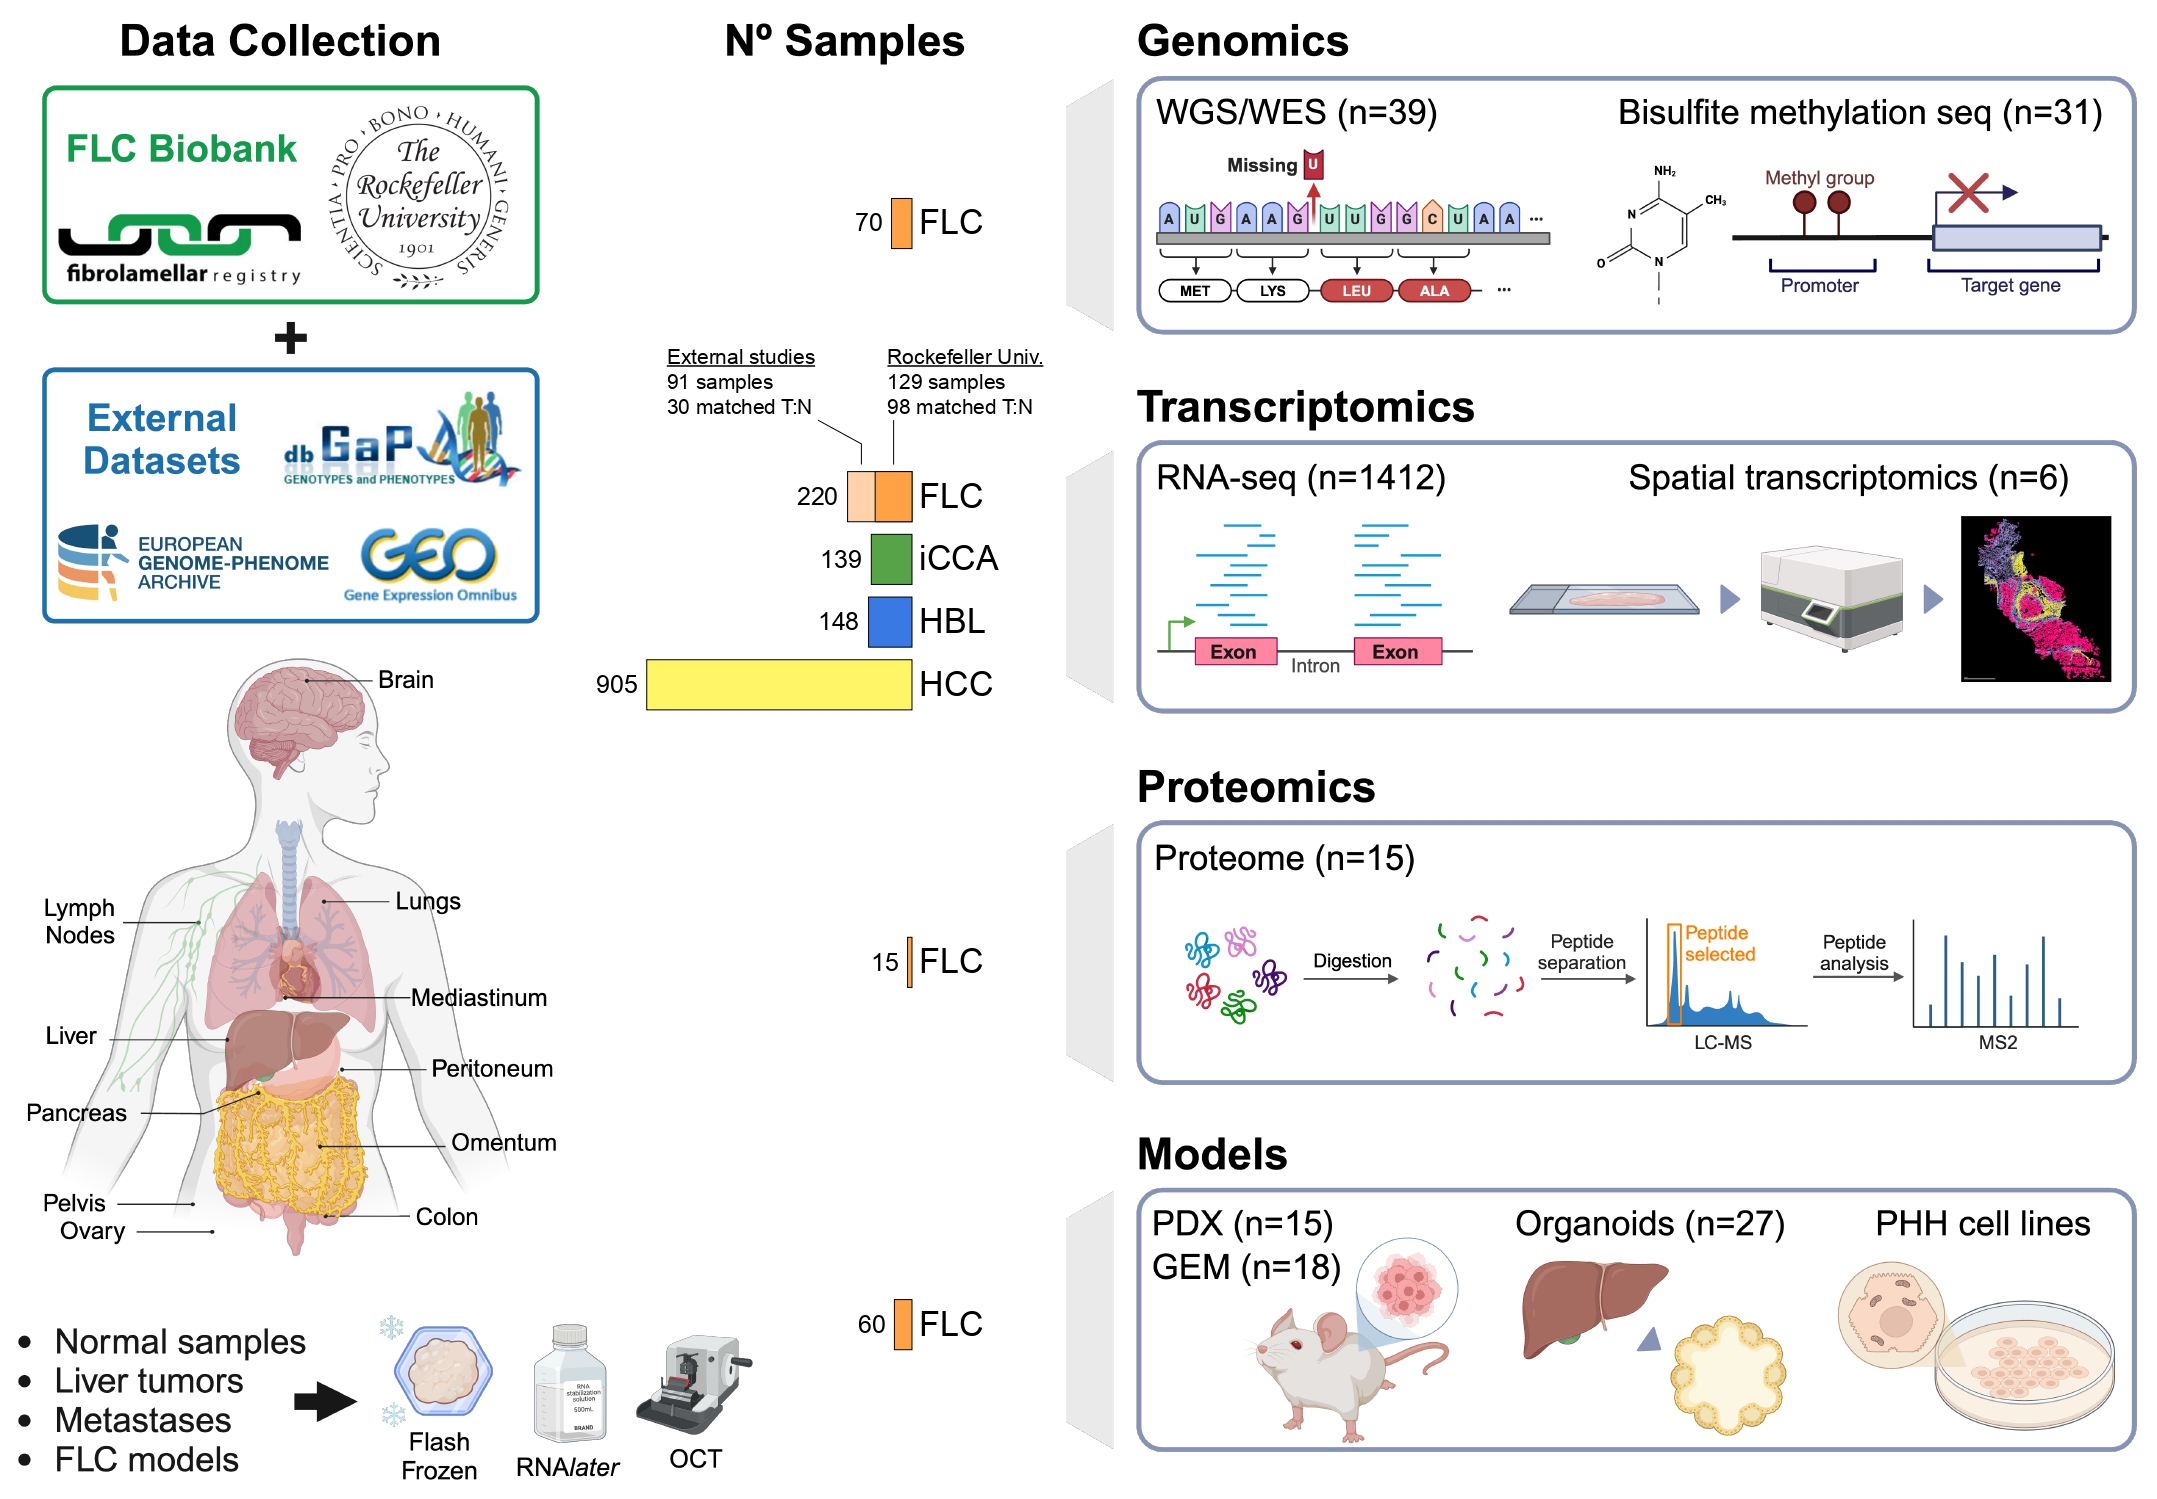
A total of 1412 samples from patients with liver cancers were collected and analyzed, representing the largest transcriptomic study of liver cancer to date.

Fibrolamellar Hepatocellular Carcinoma (FLC)

Rockefeller University:

  • Requena, D., et al. (2024). Liver cancer multiomics reveals diverse protein kinase A disruptions convergently produce fibrolamellar hepatocellular carcinoma. Nature Communications, 15:10887. https://doi.org/10.1038/s41467-024-55238-2
  • Shirani, M., et al. (2024). Increased Protein Kinase A Activity Induces Fibrolamellar Hepatocellular Carcinoma Features Independent of DNAJB1. Cancer Research, 84(16):2626–2644. https://doi.org/10.1158/0008-5472.CAN-23-4110
  • Levin, S.N., et al. (2023). Disruption of proteome by an oncogenic fusion kinase alters metabolism in fibrolamellar hepatocellular carcinoma. Science Advances, 9(25):eadg7038. https://doi.org/10.1126/sciadv.adg7038
  • Narayan, N.J.C., et al. (2022). Human liver organoids for disease modeling of fibrolamellar carcinoma. Stem Cell Reports, 17(8):1874–1888. https://doi.org/10.1016/j.stemcr.2022.06.003
  • Lalazar, G., et al. (2021). Identification of Novel Therapeutic Targets for Fibrolamellar Carcinoma Using Patient-Derived Xenografts and Direct-from-Patient Screening. Cancer Discovery, 11(10):2544–2563. https://doi.org/10.1158/2159-8290.cd-20-0872
  • Simon, E.P., et al. (2015). Transcriptomic characterization of fibrolamellar hepatocellular carcinoma. Proceedings of the National Academy of Sciences of the United States of America, 112(44):E5916–25. https://doi.org/10.1073/pnas.1424894112

Other laboratories:

Hepatoblastoma (HBL)

Intrahepatic Cholangiocarcinoma (iCCA)

  • Gao, C. et al. (2022). The A-to-I editing of KPC1 promotes intrahepatic cholangiocarcinoma by attenuating proteasomal processing of NF-κB1 p105 to p50. Journal of Experimental & Clinical Cancer Research, 41(1):338. https://doi.org/10.1186/s13046-022-02549-1
  • Ahn, K. S. et al. (2019). Prognostic subclass of intrahepatic cholangiocarcinoma by integrative molecular-clinical analysis and potential targeted approach. Hepatology International, 13(4):490–500. https://doi.org/10.1007/s12072-019-09954-3
  • Farshidfar, F. et al. (2017). Integrative Genomic Analysis of Cholangiocarcinoma Identifies Distinct IDH-Mutant Molecular Profiles. Cell Reports, 18(11):2780–94. https://doi.org/10.1016/j.celrep.2017.02.033
  • Sia, D. et al. (2015). Massive parallel sequencing uncovers actionable FGFR2-PPHLN1 fusion and ARAF mutations in intrahepatic cholangiocarcinoma. Nature Communications, 6(1):6087. https://doi.org/10.1038/ncomms7087

Hepatocellular Carcinoma (HCC)

  • Wang, K. et al. (2023). PHGDH arginine methylation by PRMT1 promotes serine synthesis and represents a therapeutic vulnerability in hepatocellular carcinoma. Nature Communications, 14(1):1011. https://doi.org/10.1038/s41467-023-36708-5
  • Long, M. et al. (2022). A novel risk score based on immune-related genes for hepatocellular carcinoma as a reliable prognostic biomarker and correlated with immune infiltration. Frontiers in Immunology, 13:1023349. https://doi.org/10.3389/fimmu.2022.1023349
  • Huang, H. et al. (2020). Integrated analysis of microbiome and host transcriptome reveals correlations between gut microbiota and clinical outcomes in HBV-related hepatocellular carcinoma. Genome Medicine, 12(1):102. https://doi.org/10.1186/s13073-020-00796-5
  • Jin, Y. et al. (2019). Comprehensive analysis of transcriptome profiles in hepatocellular carcinoma. Journal of Translational Medicine, 17(1):273. https://doi.org/10.1186/s12967-019-2025-x
  • Li, S. et al. (2019). Transcriptome-Wide Analysis Reveals the Landscape of Aberrant Alternative Splicing Events in Liver Cancer. Hepatology, 69(1):359–375. https://doi.org/10.1002/hep.30158
  • Yoo, S. et al. (2017). A pilot systematic genomic comparison of recurrence risks of hepatitis B virus-associated hepatocellular carcinoma with low- and high-degree liver fibrosis. BMC Medicine, 15(1):214. https://doi.org/10.1186/s12916-017-0973-7
  • Cancer Genome Atlas Research Network (2017). Comprehensive and Integrative Genomic Characterization of Hepatocellular Carcinoma. Cell, 169(7):1327–1341.e23. https://doi.org/10.1016/j.cell.2017.05.046
  • Yang, Y. et al. (2017). Recurrently deregulated lncRNAs in hepatocellular carcinoma. Nature Communications, 8(1):14421. https://doi.org/10.1038/ncomms14421
  • Liu, G. et al. (2016). Potential diagnostic and prognostic marker dimethylglycine dehydrogenase (DMGDH) suppresses hepatocellular carcinoma metastasis in vitro and in vivo. Oncotarget, 7(22):32607–16. https://doi.org/10.18632/oncotarget.8927

The data to generate the plots is in:

Cancer Database Accession Articles
Fibrolamellar Hepatocellular Carcinoma
(FLC)
dbGaP phs003643 Requena et al., 2024
phs002439 Narayan et al., 2022
phs002435 Lalazar et al., 2021
phs000178 The Cancer Genome Atlas Research Network, 2017
phs000709 Simon et al., 2015
phs000828 Xu et al., 2015
GEO GSE181922 Francisco et al., 2022
GSE63018 Sorenson et al., 2017
Hepatoblastoma
(HBL)
GEO GSE151347 Wagner et al., 2020
GSE133039 Carrillo-Reixach et al., 2020
GSE104766 Hooks et al., 2018
Intrahepatic Cholangiocarcinoma
(iCCA)
GEO GSE119336 Gao et al., 2022
GSE107943 Ahn et al., 2019
GSE63420 Sia et al., 2015
dbGaP phs000178 The Cancer Genome Atlas Research Network, 2017
Hepatocellular Carcinoma
(HCC)
GEO GSE207435 Wang et al., 2023
GSE214846 Long et al., 2022
GSE105130 Jin et al., 2019
GSE94660 Yoo et al., 2017
GSE77276 Yang et al., 2017
GSE77314 Hou et al., 2016
EGA EGAD00001005308 Hirsch et al., 2020
dbGaP phs000673 Robinson et al., 2017
phs000178 The Cancer Genome Atlas Research Network, 2017

Dear members of the Fibrolamellar Carcinoma community:

In the decade that the Fibrolamellar Registry has been working, our goal has been to bring patients, family members, scientists, and clinicians together. By joining our data together, we have been able to create a critical mass of information that has already contributed to a number of publications.

We believe that it is the patients who are making the biggest sacrifices for this research by donating tissue, blood, and information. These contributions provide an invaluable resource for scientific discovery, and we believe it is critical to bring the science generated from them back to the patients. That is why we provide information on how to search PubMed (the database of scientific articles published by the NIH): https://fibroregistry.org/browse-pubmed/; a list of articles on fibrolamellar carcinoma (FLC) with plain-language summaries (https://fibroregistry.org/published-papers/); frequently asked questions about the science, key fibrolamellar terms, and a video about the science (https://fibroregistry.org/science-landing/). We also encourage all scientists to pay extra to make their articles available immediately and for free to the patient community.

Here, we have a website that allows you to explore the latest multiomics research on FLC. You can examine how gene expression changes from normal liver to primary tumors, metastases, and recurrences; compare results across seven different labs and across FLC, hepatocellular carcinoma (HCC), hepatoblastoma (HBL), and cholangiocarcinoma (iCCA); and explore changes at the genomic, proteomic, and methylomic levels. Altogether, we have brought together data from close to a thousand patients.

Fibrolamellar Hepatocellular Carcinoma (FLC) is a rare liver cancer of adolescents and young adults. By integrating these different types of data in the FLC Data Base (FLC-DB), we can explore FLC biology from multiple perspectives and investigate questions such as how increased kinase activity can produce such a consistent molecular profile, even across tumors with different cellular origins and with relatively few transcripts varying between them. The FLC-DB makes these datasets accessible through interactive analyses and publication-ready plots and tables, with a comprehensive tutorial on how to use the website.

Why is this of interest? Changes in gene expression, DNA, proteins, and methylation provide complementary views of what is happening in a tumor and can help identify biological mechanisms and potential therapeutic opportunities. FLC-DB gives you a chance to explore data that, until now, has largely only been available to scientists.

One of the goals of the FLC-DB is therefore to give back to the community by making the knowledge generated from patient contributions accessible and useful for further research. This is intended to be a growing resource that will continue to evolve as new patient-derived data and scientific findings become available. We will soon also incorporate data on patient survival, further expanding the types of questions that can be explored through the database.

Please reach out with any suggestions!

We would like to thank Daniel Guevara, David Requena, Luis Soto, and Aldhair Medico in The Simon Lab at The Rockefeller University for their hard work in creating this resource for the patient community.

About Us

The Simon Laboratory at Rockefeller University has been studying Fibrolamellar Carcinoma since 2011. To learn more about our path, please watch our YouTube videos:

Check out the most recent news about the lab:

And visit our patient resources:

Contact

Sanford M. Simon
Günter Blobel Professor
Laboratory of Cellular Biophysics
The Rockefeller University
1230 York Ave, New York, NY, USA
simon@rockefeller.edu

The FLC Signature

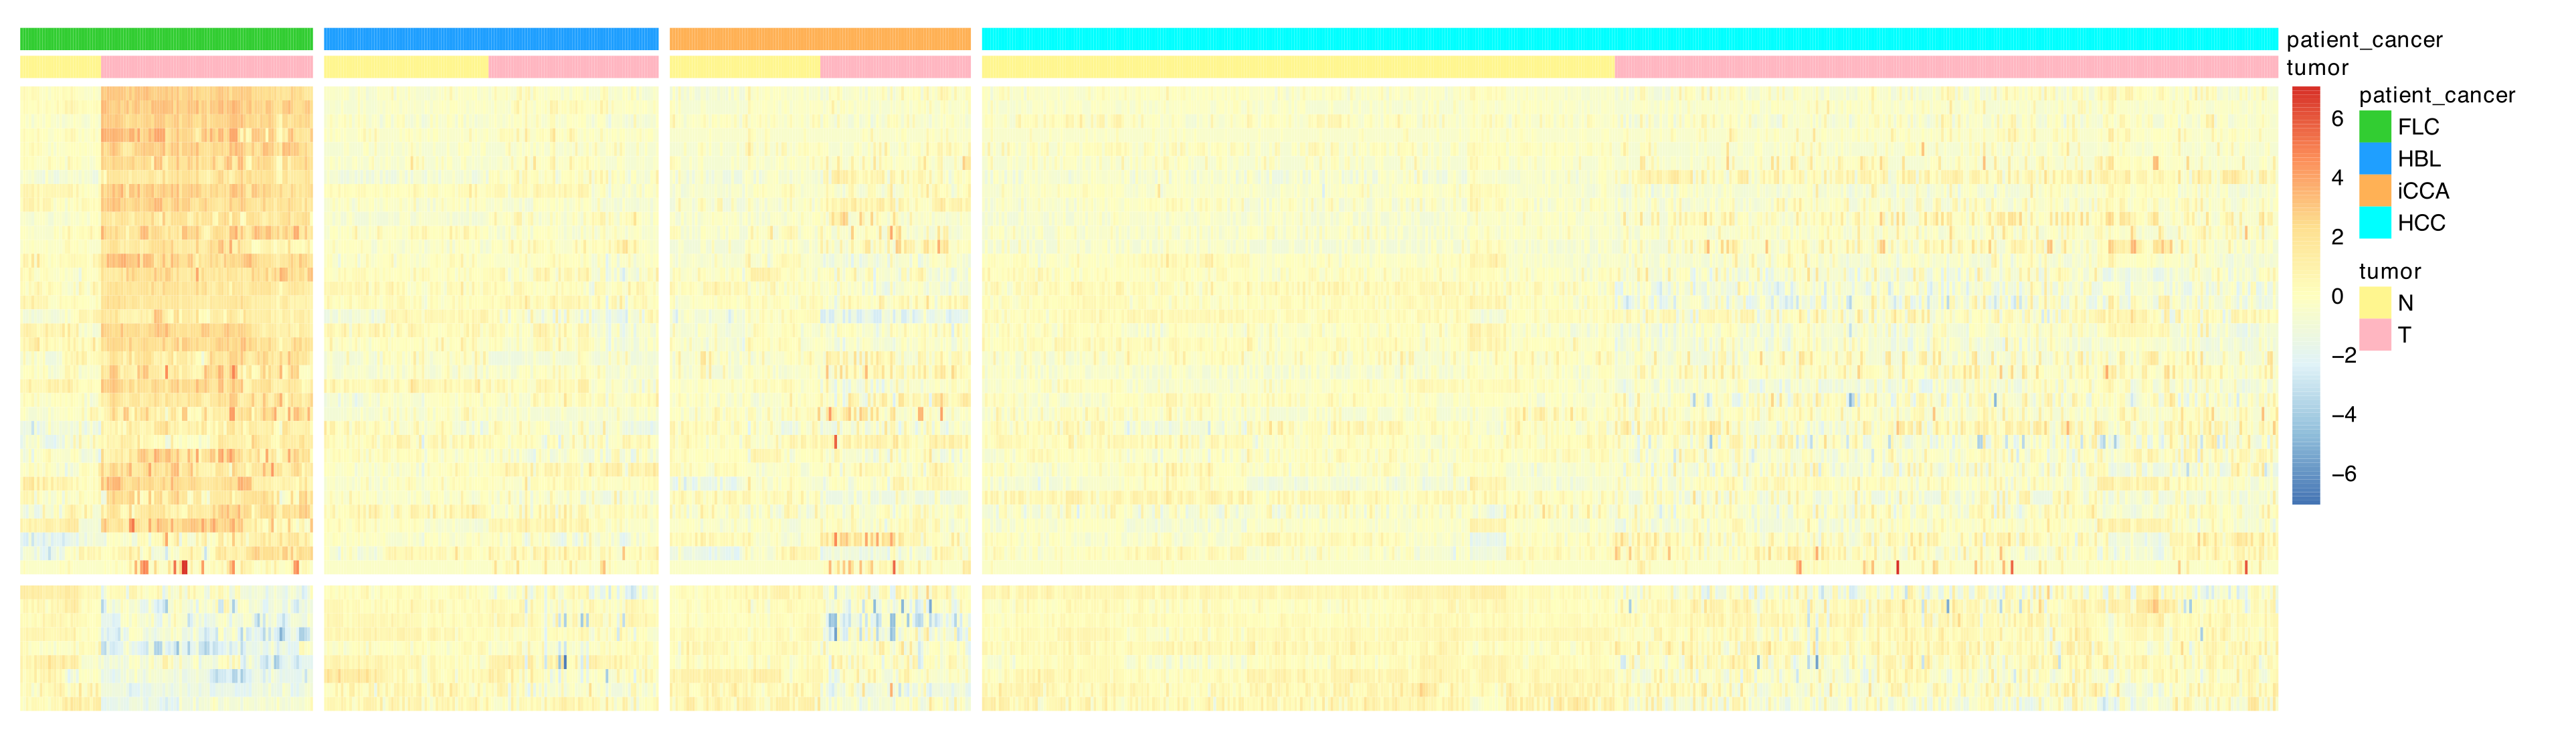
The transcriptomic FLC Signature is a set of 693 genes that define a common pattern found in all FLC tumors, regardless of how the PKA pathway is activated. Within this signature, we identified 287 genes that are more active (upregulated) and 406 that are less active (downregulated) only in FLC, meaning these changes were not seen in other types of liver cancer. From that, a smaller group of 44 genes (called the FLC Gene Set) was selected. When considered together, the expression of these 44 genes can help distinguish FLC tumors from other liver cancers. Below is the complete list of the 693 genes from the FLC Signature indicating which genes also belong to the FLC Gene Set:


FLC Signature expression heatmap
Rows represent the 693 genes in the FLC Signature, and columns represent patients categorized by sample type (Tumor, Normal) and cancer type (FLC, HBL, iCCA, HCC). The color scale corresponds to normalized scaled expression.

The FLC Geneset

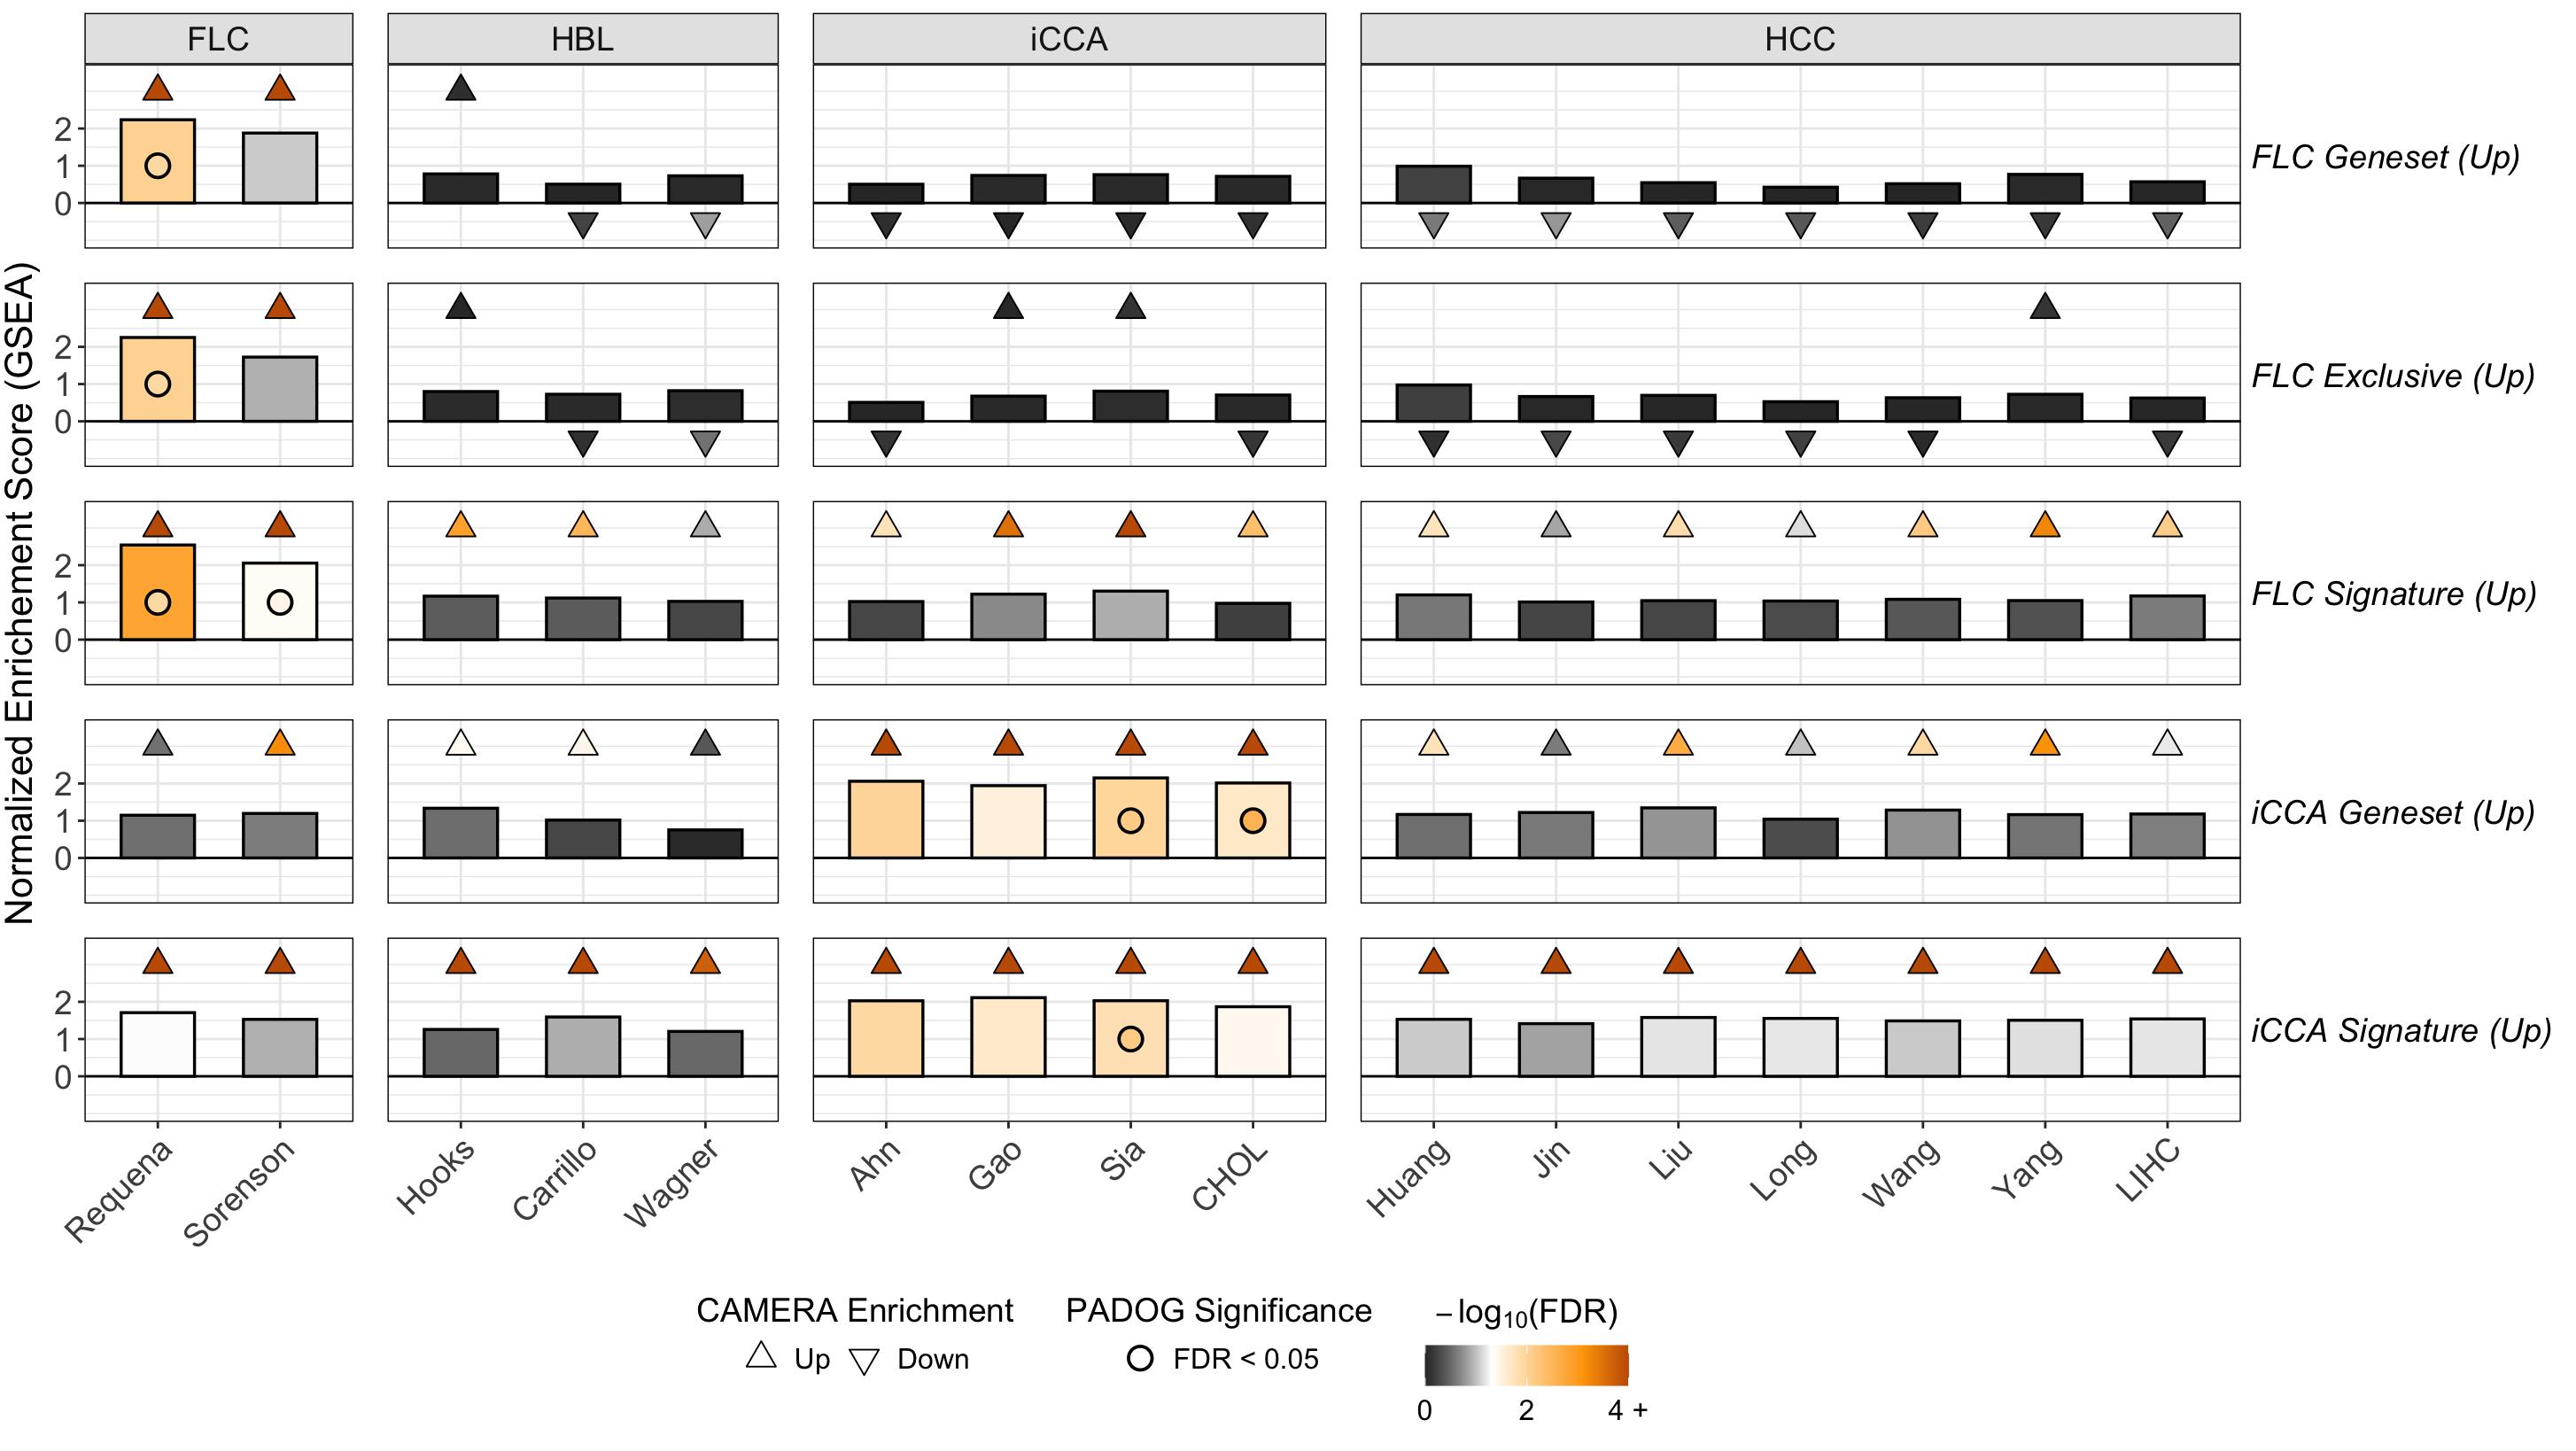
The upregulated genes from the FLC Geneset were incorporated into MSigDB and evaluated using GSEA, CAMERA, and PADOG. Only the three upregulated gene groups derived from FLC consistently distinguished it from other liver cancers, while the upregulated components of the iCCA Signature and Geneset similarly showed disease-specific enrichment.

Pathway Enrichment Analysis
Color indicates significance across all methods, arrows show the direction of enrichment from CAMERA, bars represent enrichment magnitude from GSEA, and circles represent PADOG results.

Tutorial

How to use the FLC-DB

Our goal is to make the science of studying fibrolamellar carcinoma (FLC) accessible not only to the research community, but also to the patient community. It is the patients who have provided the tissue and their histories, and this resource is provided as a service to them.

Scientists often study different diseases by examining how the disease affects the expression of different genes. As a quick reminder, your genetic information is stored in long pieces of DNA called chromosomes. Chromosomes store genetic information. For that information to be used by the cell, the DNA must first be copied into a slightly different molecule called RNA. These RNA molecules are frequently referred to as transcripts. By studying increases or decreases in RNA levels, it is possible to gain insight into the nature of a disease.

Moreover, there are two additional layers of information beyond the genetic code. Proteins are the result of translating the nucleic acid language of DNA and RNA into amino acids, generating the molecular machines that perform virtually every process in the cell. Going back to DNA, methylation is a modification that helps control whether a gene undergoes this process of transferring information from DNA to RNA and, ultimately, proteins.

Apart from the molecular characterization of the disease, it is important to understand its epidemiology: What are the risk factors and comorbidities? What is the overall survival? Therefore, we also include patient survival data and hope to integrate this with the rich molecular information we have generated.

There are three main sections of analysis that are explained through the tabs on the left-hand side of the screen:

  1. Transcriptomics Tab: Used to explore which genes increase or decrease in tumors.
  2. Genomics Tab: Used to explore point mutations in the DNA.
  3. Multiomics Tab: Used to explore protein levels in tumors, patient survival data, DNA methylation, and the integration of multiple types of molecular data.

Transcriptomics

Here we give you different ways to explore changes in gene expression in FLC. For FLC, we have combined the “transcripts” (meaning gene expression, or RNA levels) from 148 different patients across 7 different labs. This is further enhanced by including transcripts from almost 1000 additional patients with other liver cancers, including cholangiocarcinoma, hepatoblastoma, and hepatocellular carcinoma.

When you move to the Transcriptomics tab (at the top), you will see two different subtabs:

  • Distribution of Gene Counts
  • Differential Expression Analysis

The following describes what you can see in each.

Distribution of Gene Counts

The Distribution of Gene Counts tab provides three different and independent analyses/plots:

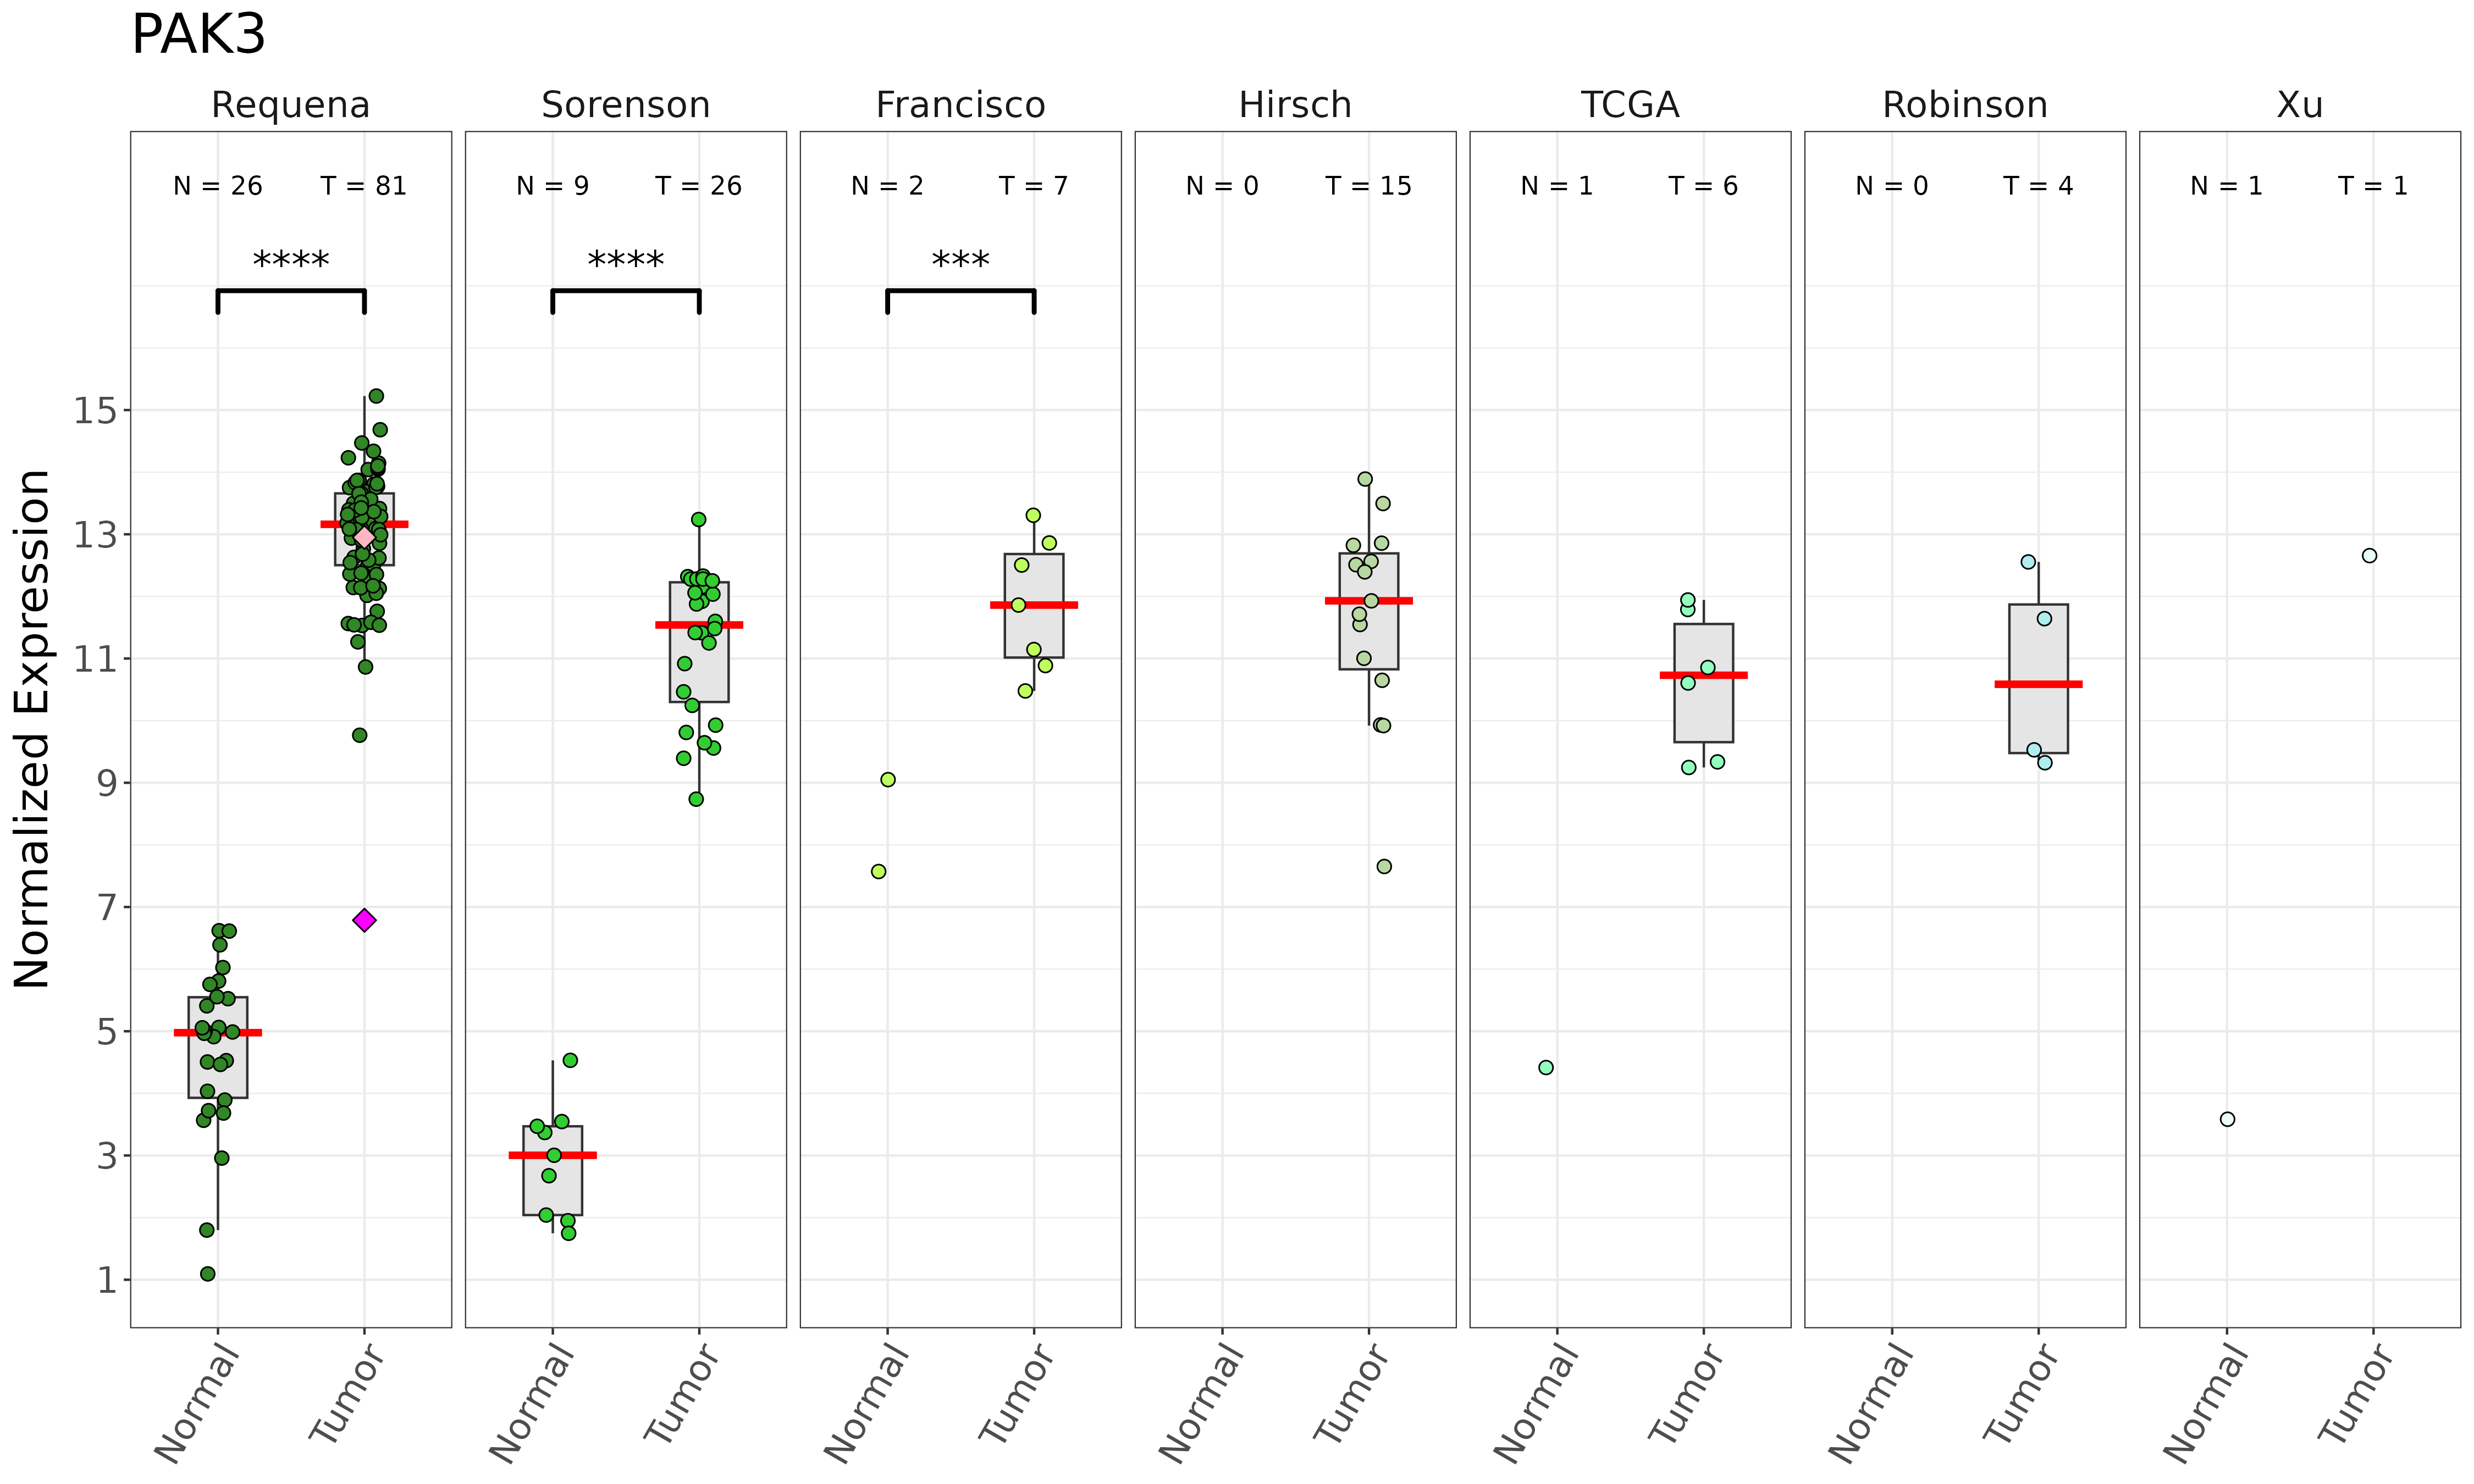
  1. The first helps you explore FLC transcripts (gene expression) by comparing Normal and Tumor samples.
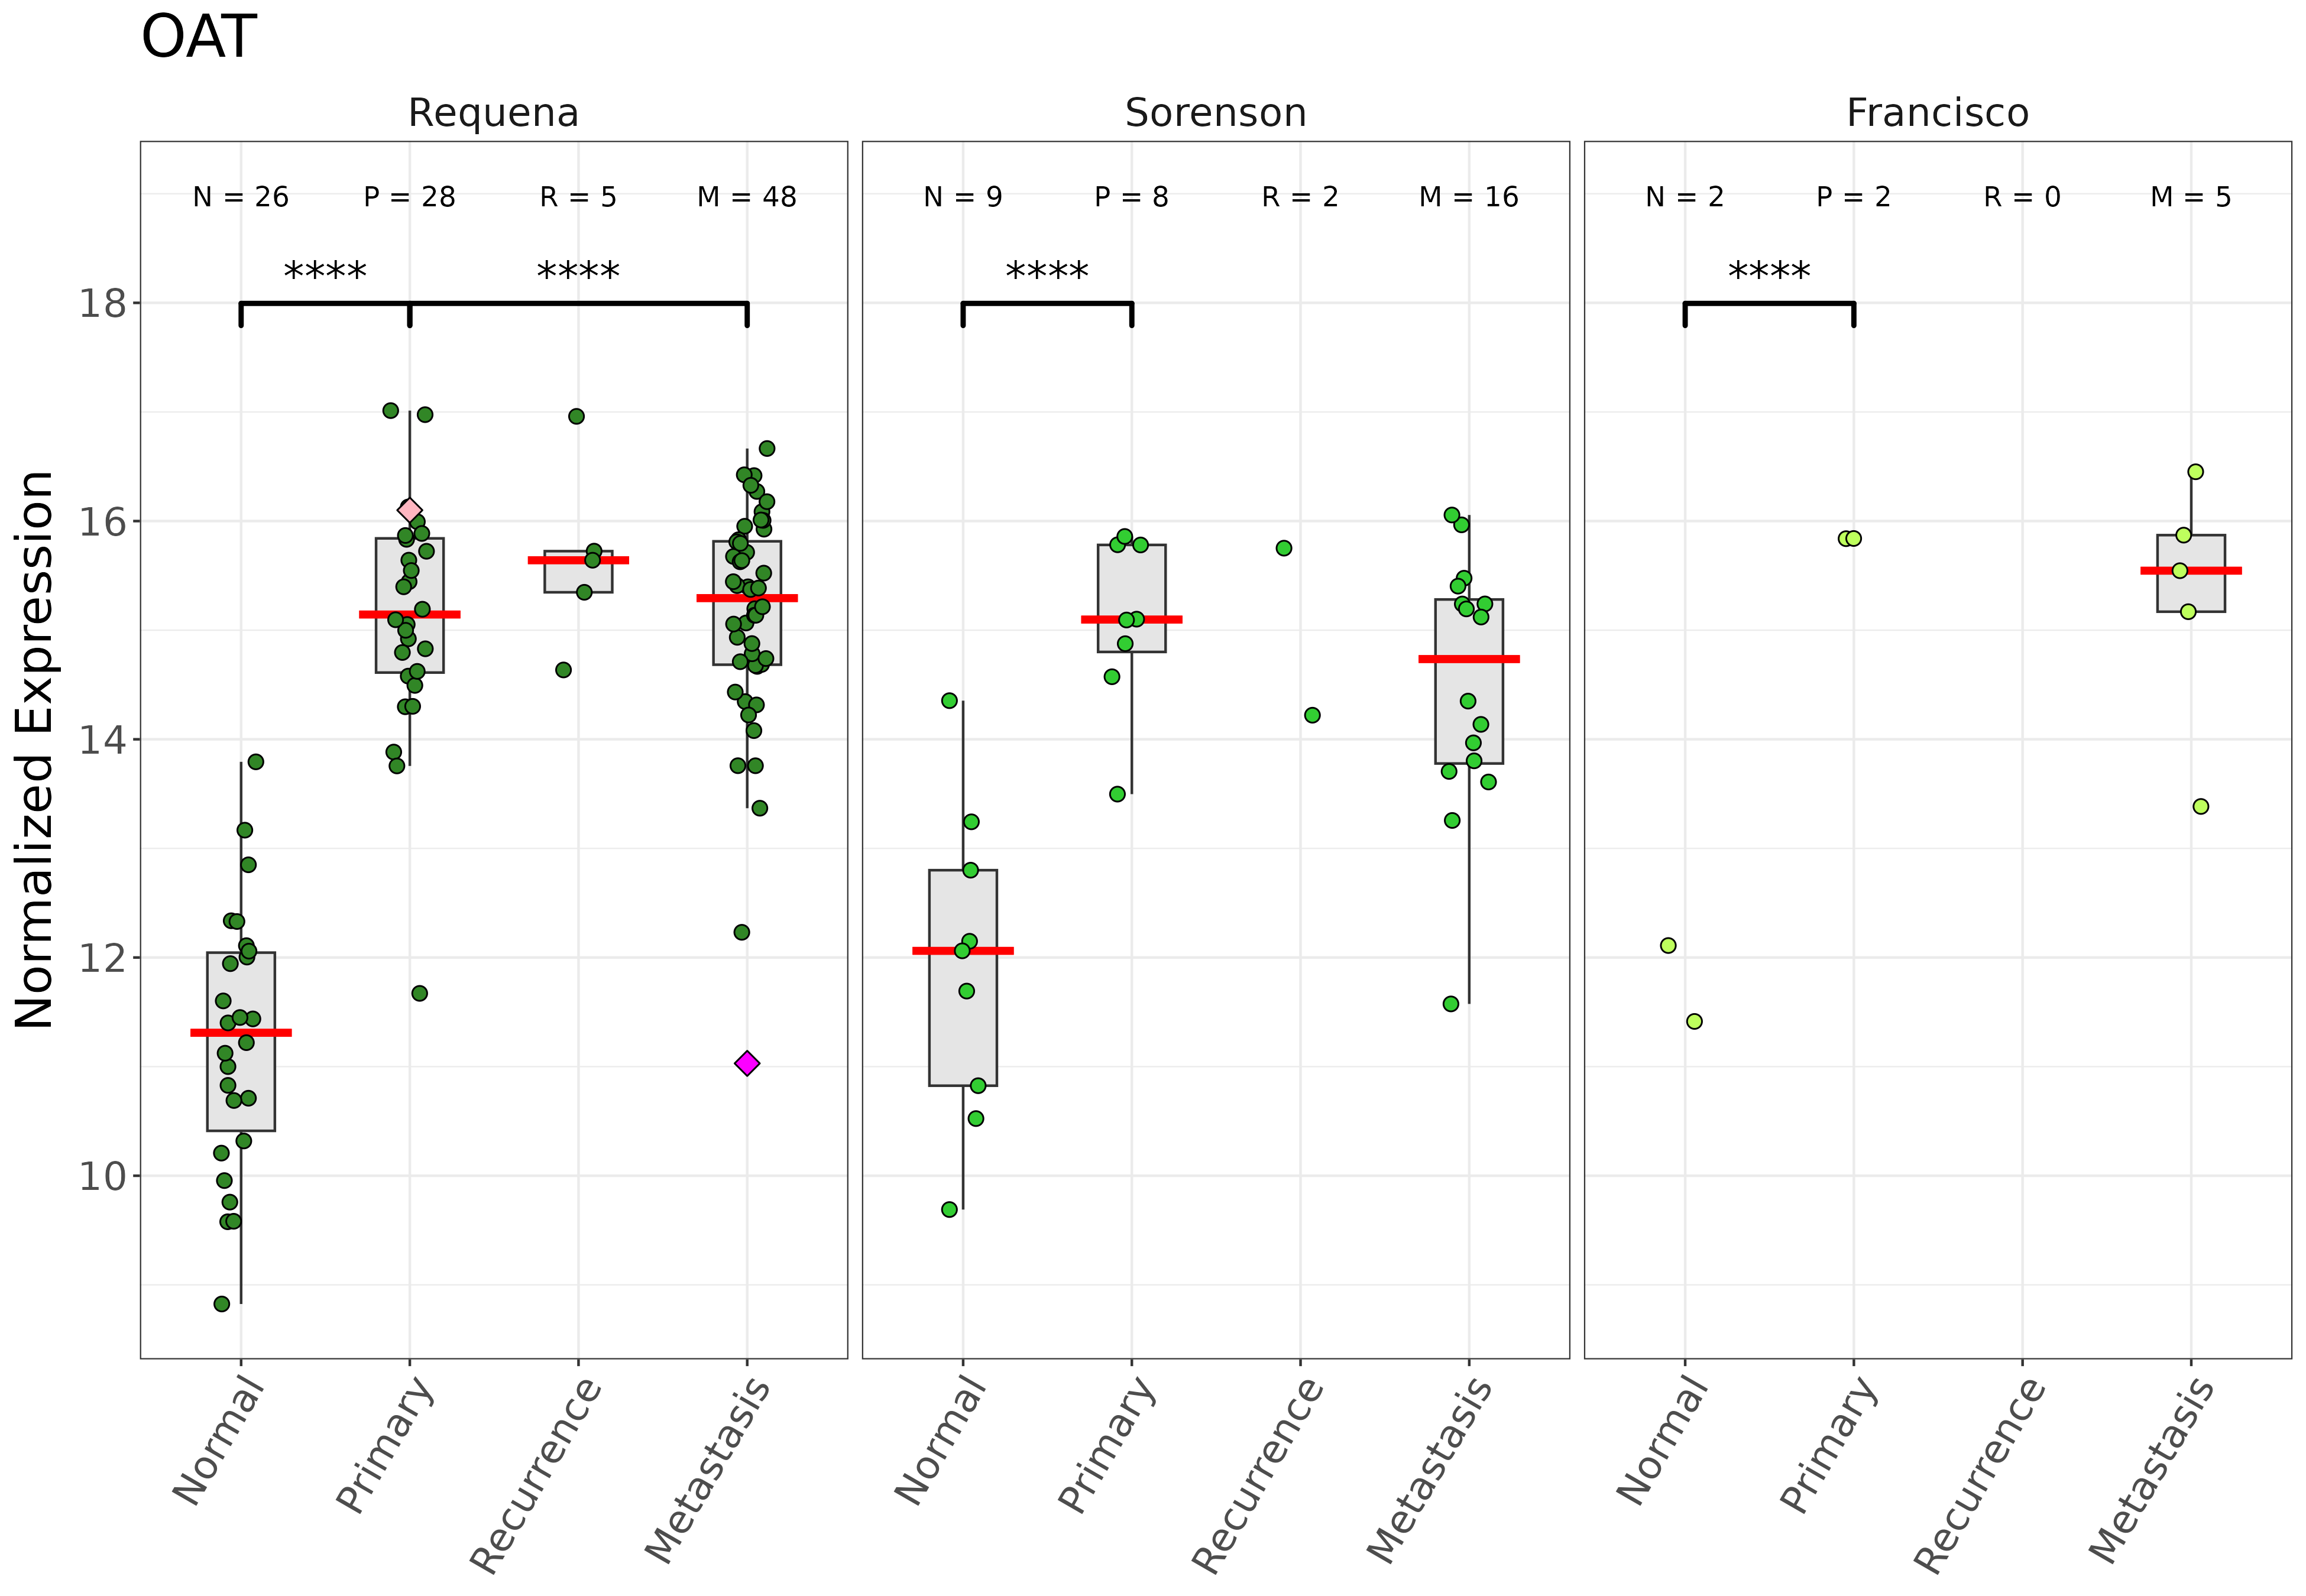
  2. The second helps you explore FLC transcripts (gene expression) from a smaller subset of patients that includes Normal, Primary Tumor, Recurrence, and Metastasis samples.
  3. The third helps you explore transcripts (gene expression) from different types of liver cancer by comparing Normal and Tumor samples.

Analysis 1: Gene Expression (Transcripts) for FLC tumor and normal

You can type in the name of any particular gene you are interested in, and this App will generate boxplots and dot plots for the transcripts (more precisely, Normalized Counts) of each gene across datasets from different labs, considering both Normal (N) and Tumor (T) samples. Samples are colored based on the laboratory where the data was retrieved and processed.

Analysis 2: Gene Expression (Transcripts) for FLC comparing normal, primary tumor, recurrence and metastases

This analysis generates boxplots and dot plots for the transcripts (more precisely, Normalized Counts) of each gene across datasets from different labs, separated into Normal (N), Primary (P), Recurrence (R), and Metastasis (M) samples. Samples are colored based on the laboratory where the data was retrieved and processed.

Analysis 3: Gene Expression (Transcripts) comparing different liver cancers

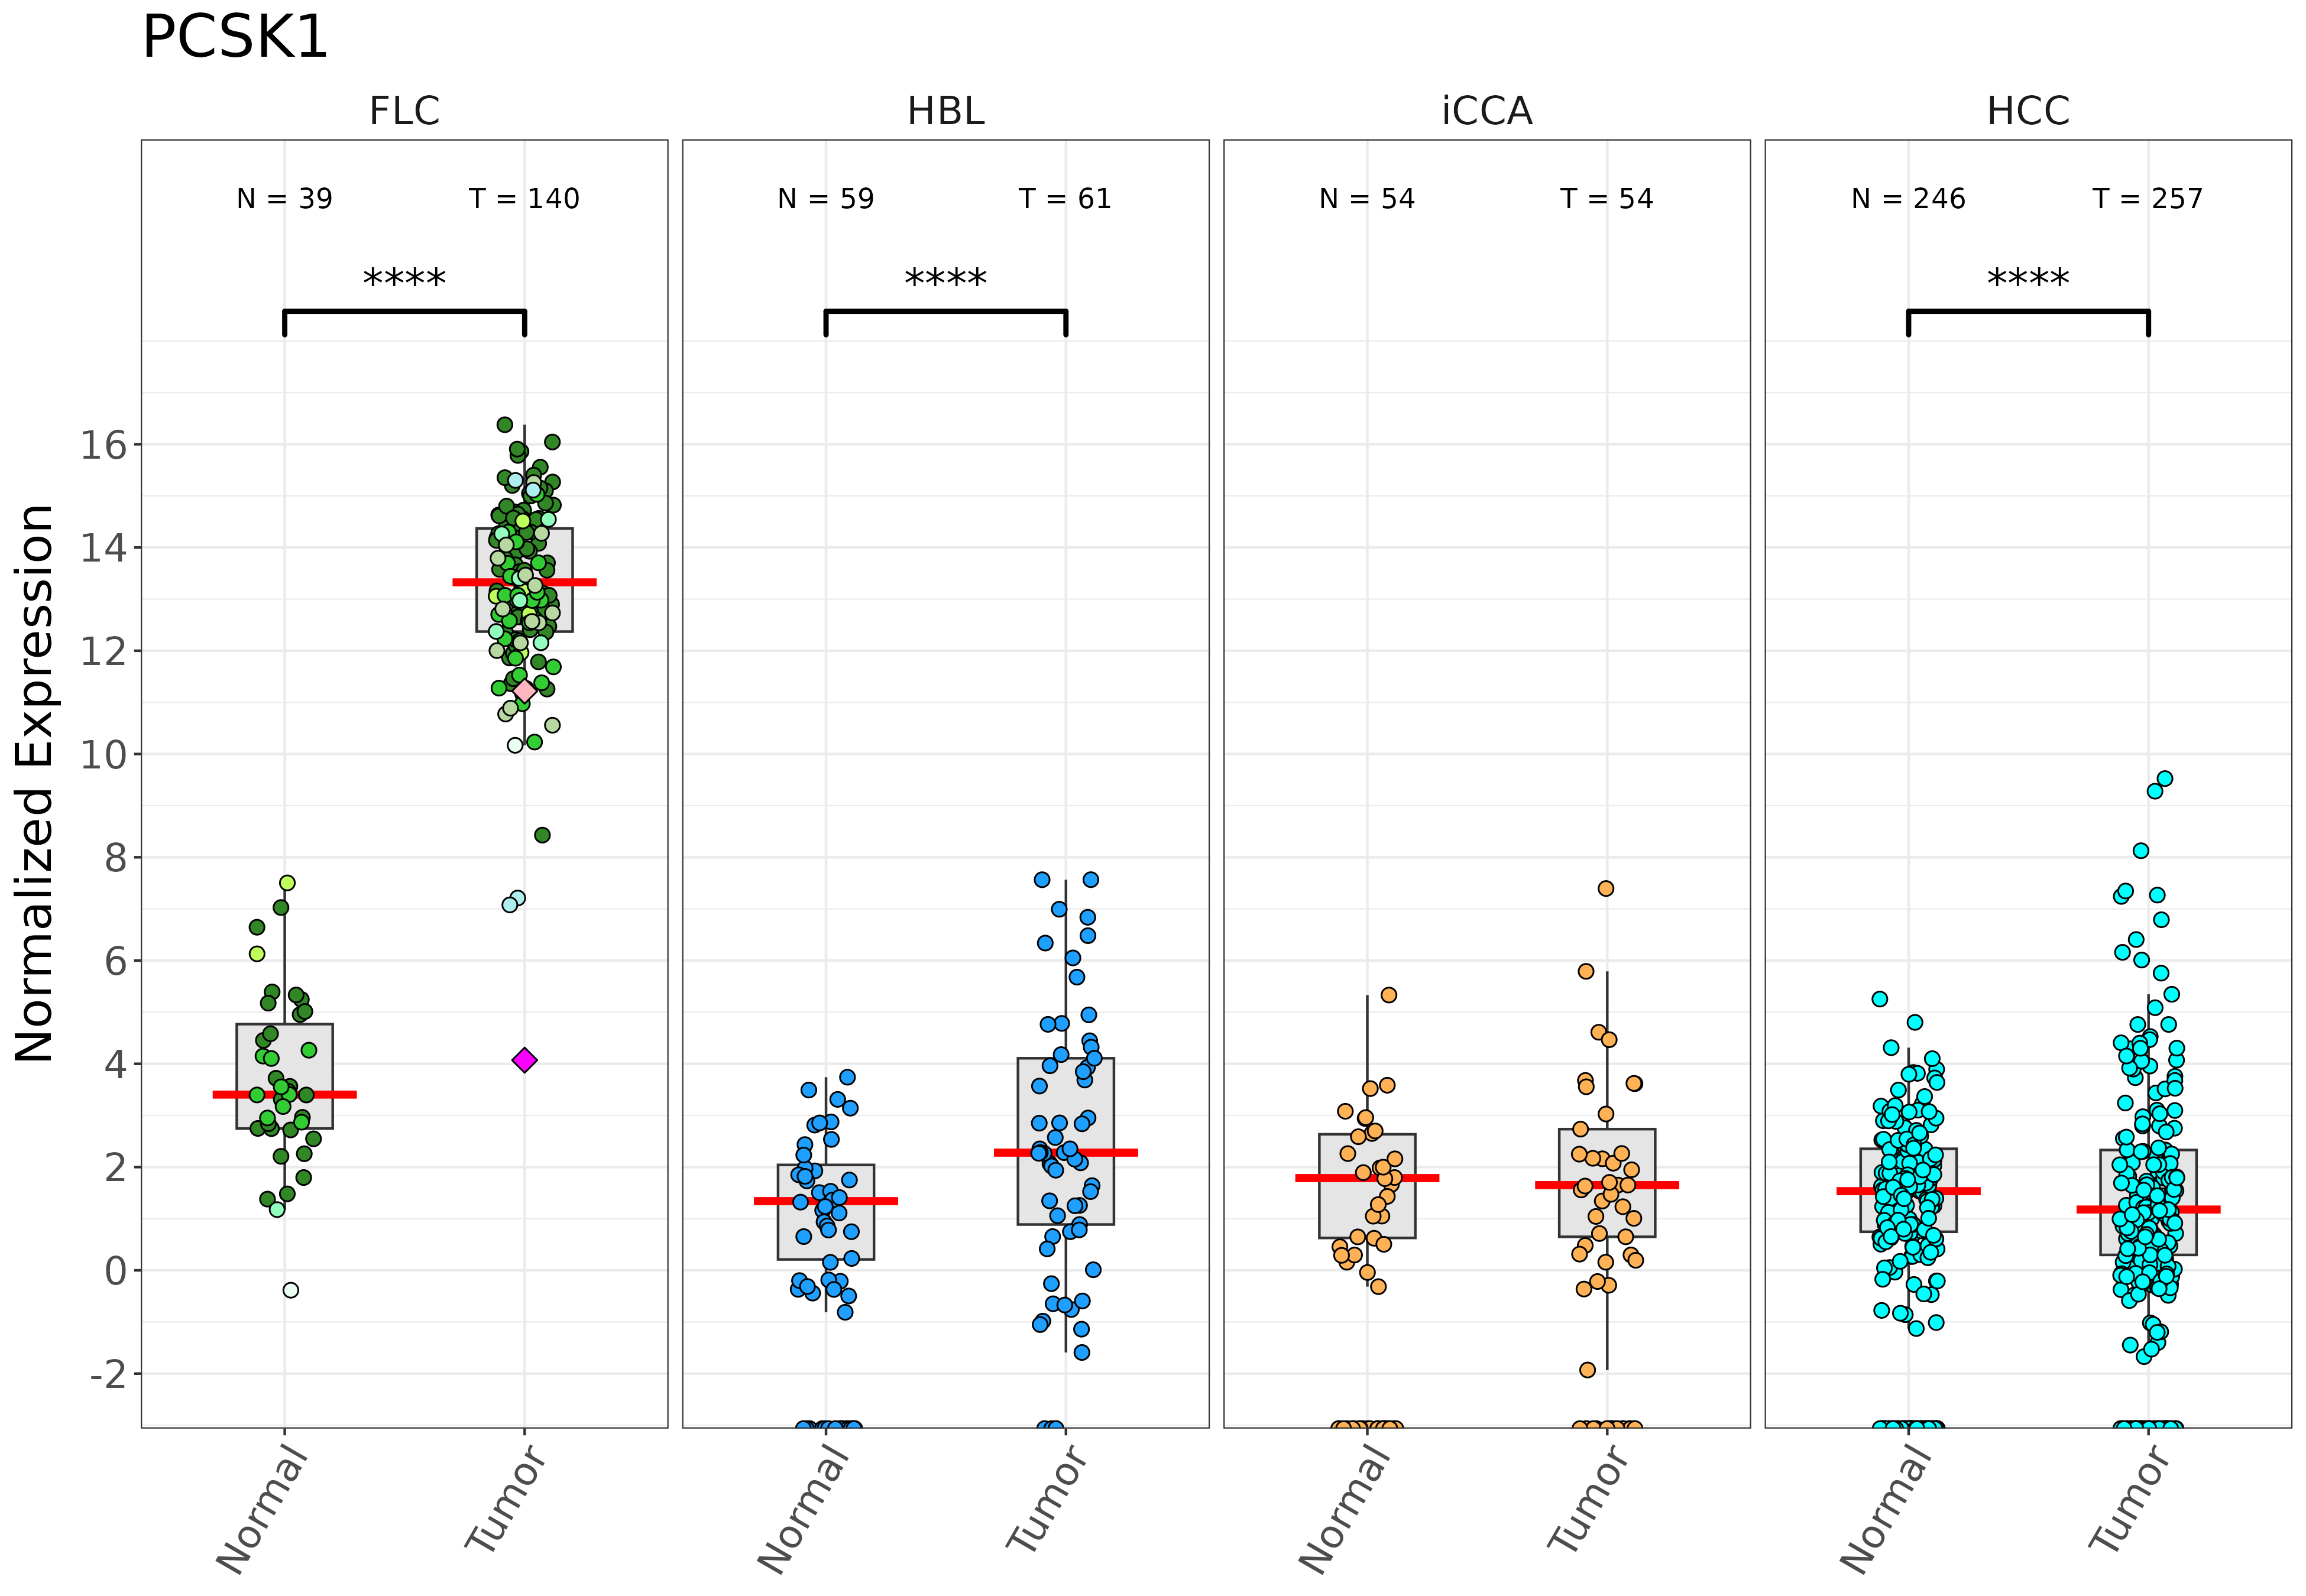
This analysis generates boxplots and dot plots for the transcripts (more precisely, Normalized Counts) of each gene across different types of liver cancer. Samples are colored based on the cancer type: Fibrolamellar Carcinoma (FLC), Hepatoblastoma (HBL), Intrahepatic Cholangiocarcinoma (iCCA), and Hepatocellular Carcinoma (HCC).

Detailed Interaction Features

Each plot in the Distribution of Gene Counts tab offers several interactive features to enhance the user experience and provide insights into the data.

Parameters:
  • Human Gene: Users can input an HGNC symbol or an ENSG code for any gene. The input is case-insensitive and not dependent on gene version. If the gene is not found in our dataset, a warning message will be displayed.
  • Datasets: Users can select the datasets of interest from a provided list. By default, all datasets are considered and included in the plot.
  • Plot Parameters: Users can specify the width, height, and file extension for the plot they wish to download. The plot can be downloaded in SVG or PDF format by clicking the Download button.
  • Plot button: After specifying the gene of interest, selecting the datasets, and setting the plot parameters, users need to click the Show Plot button to generate the plot, which will be displayed on the right side of the screen.
Plot Details:
  • Y axis: This is the level of gene expression, but expressed using what is called a logarithmic (or log) scale. In this case, it is a “log2” scale. This means that for each increase of 1 on the vertical axis, the value doubles. Therefore, an increase of 2 means it has doubled twice (or is four-fold higher), an increase of 3 is eight-fold higher, and an increase of 4 is 16-fold higher.

  • Gene Information: The plot title displays both the gene symbol and the ENSG (Ensembl Gene) code. This dual labeling ensures that users can quickly identify the gene of interest.

  • Hyperlink to GeneCards: Each gene symbol and ENSG code is hyperlinked to the GeneCards database. By clicking on these links, users can access comprehensive information about the gene, including its function, associated disorders, and relevant literature.

  • FLC Signature and FLC Gene Set: It indicates whether a gene is part of the FLC Signature, a list of 693 differentially expressed genes that distinguish FLC from other liver cancers. It also shows whether the gene is among the 44 most representative FLC genes, referred to as the FLC Gene Set.

  • False Discovery Rate (FDR): This measures the “significance” of an observation. If it is a single value you are looking at and the p-value is 0.05, that means it has a 0.05 chance out of 1 of being a mistake (that is, 1:20). If the p-value is 0.01, that means it has a 1:100 chance. The lower the p-value, the less likely it is that the observed difference (e.g., Tumor vs Normal) occurred by chance — so, the lower the p-value, the stronger the evidence for a real effect. However, if you examine twenty different genes, each of which has a 1:20 chance of appearing significant by chance, then you might find one that appears significant even though the result occurred by chance. Therefore, we use a more rigorous standard that accounts for how many different genes are being examined. This is known as the false discovery rate (FDR) or adjusted p-value. If there are approximately 65,000 coding and noncoding genes, you need a much lower value to be confident that an observation did not occur by chance. In all of these analyses, we use this more rigorous standard. Asterisks indicate significance thresholds as follows: * = 0.05, ** = 0.01, *** = 0.005, **** = 0.001.

  • Sample count: The number of samples per Normal and Tumor group is displayed at the top of the plot.

Transcriptomics

Here we give you different ways to explore changes in gene expression in FLC. For FLC, we have combined the “transcripts” (meaning gene expression, or RNA levels) from 148 different patients across 7 different labs. This is further enhanced by including transcripts from almost 1000 additional patients with other liver cancers, including cholangiocarcinoma, hepatoblastoma, and hepatocellular carcinoma.

When you move to the Transcriptomics tab (at the top), you will see two different subtabs:

  • Distribution of Gene Counts
  • Differential Expression Analysis

The following describes what you can see in each.

Differential Expression Analysis

The Differential Expression Analysis tab provides an integrated analysis to compare differentially expressed genes from our Fibrolamellar Carcinoma (FLC) Signature with other liver cancers. Here, you can choose to look only at transcripts that are upregulated or downregulated. You can also filter the results based on how large the difference is between Tumor and Normal samples or how highly expressed a particular gene is in the tissue.

Tool Outputs

This tool generates four different but related plots:

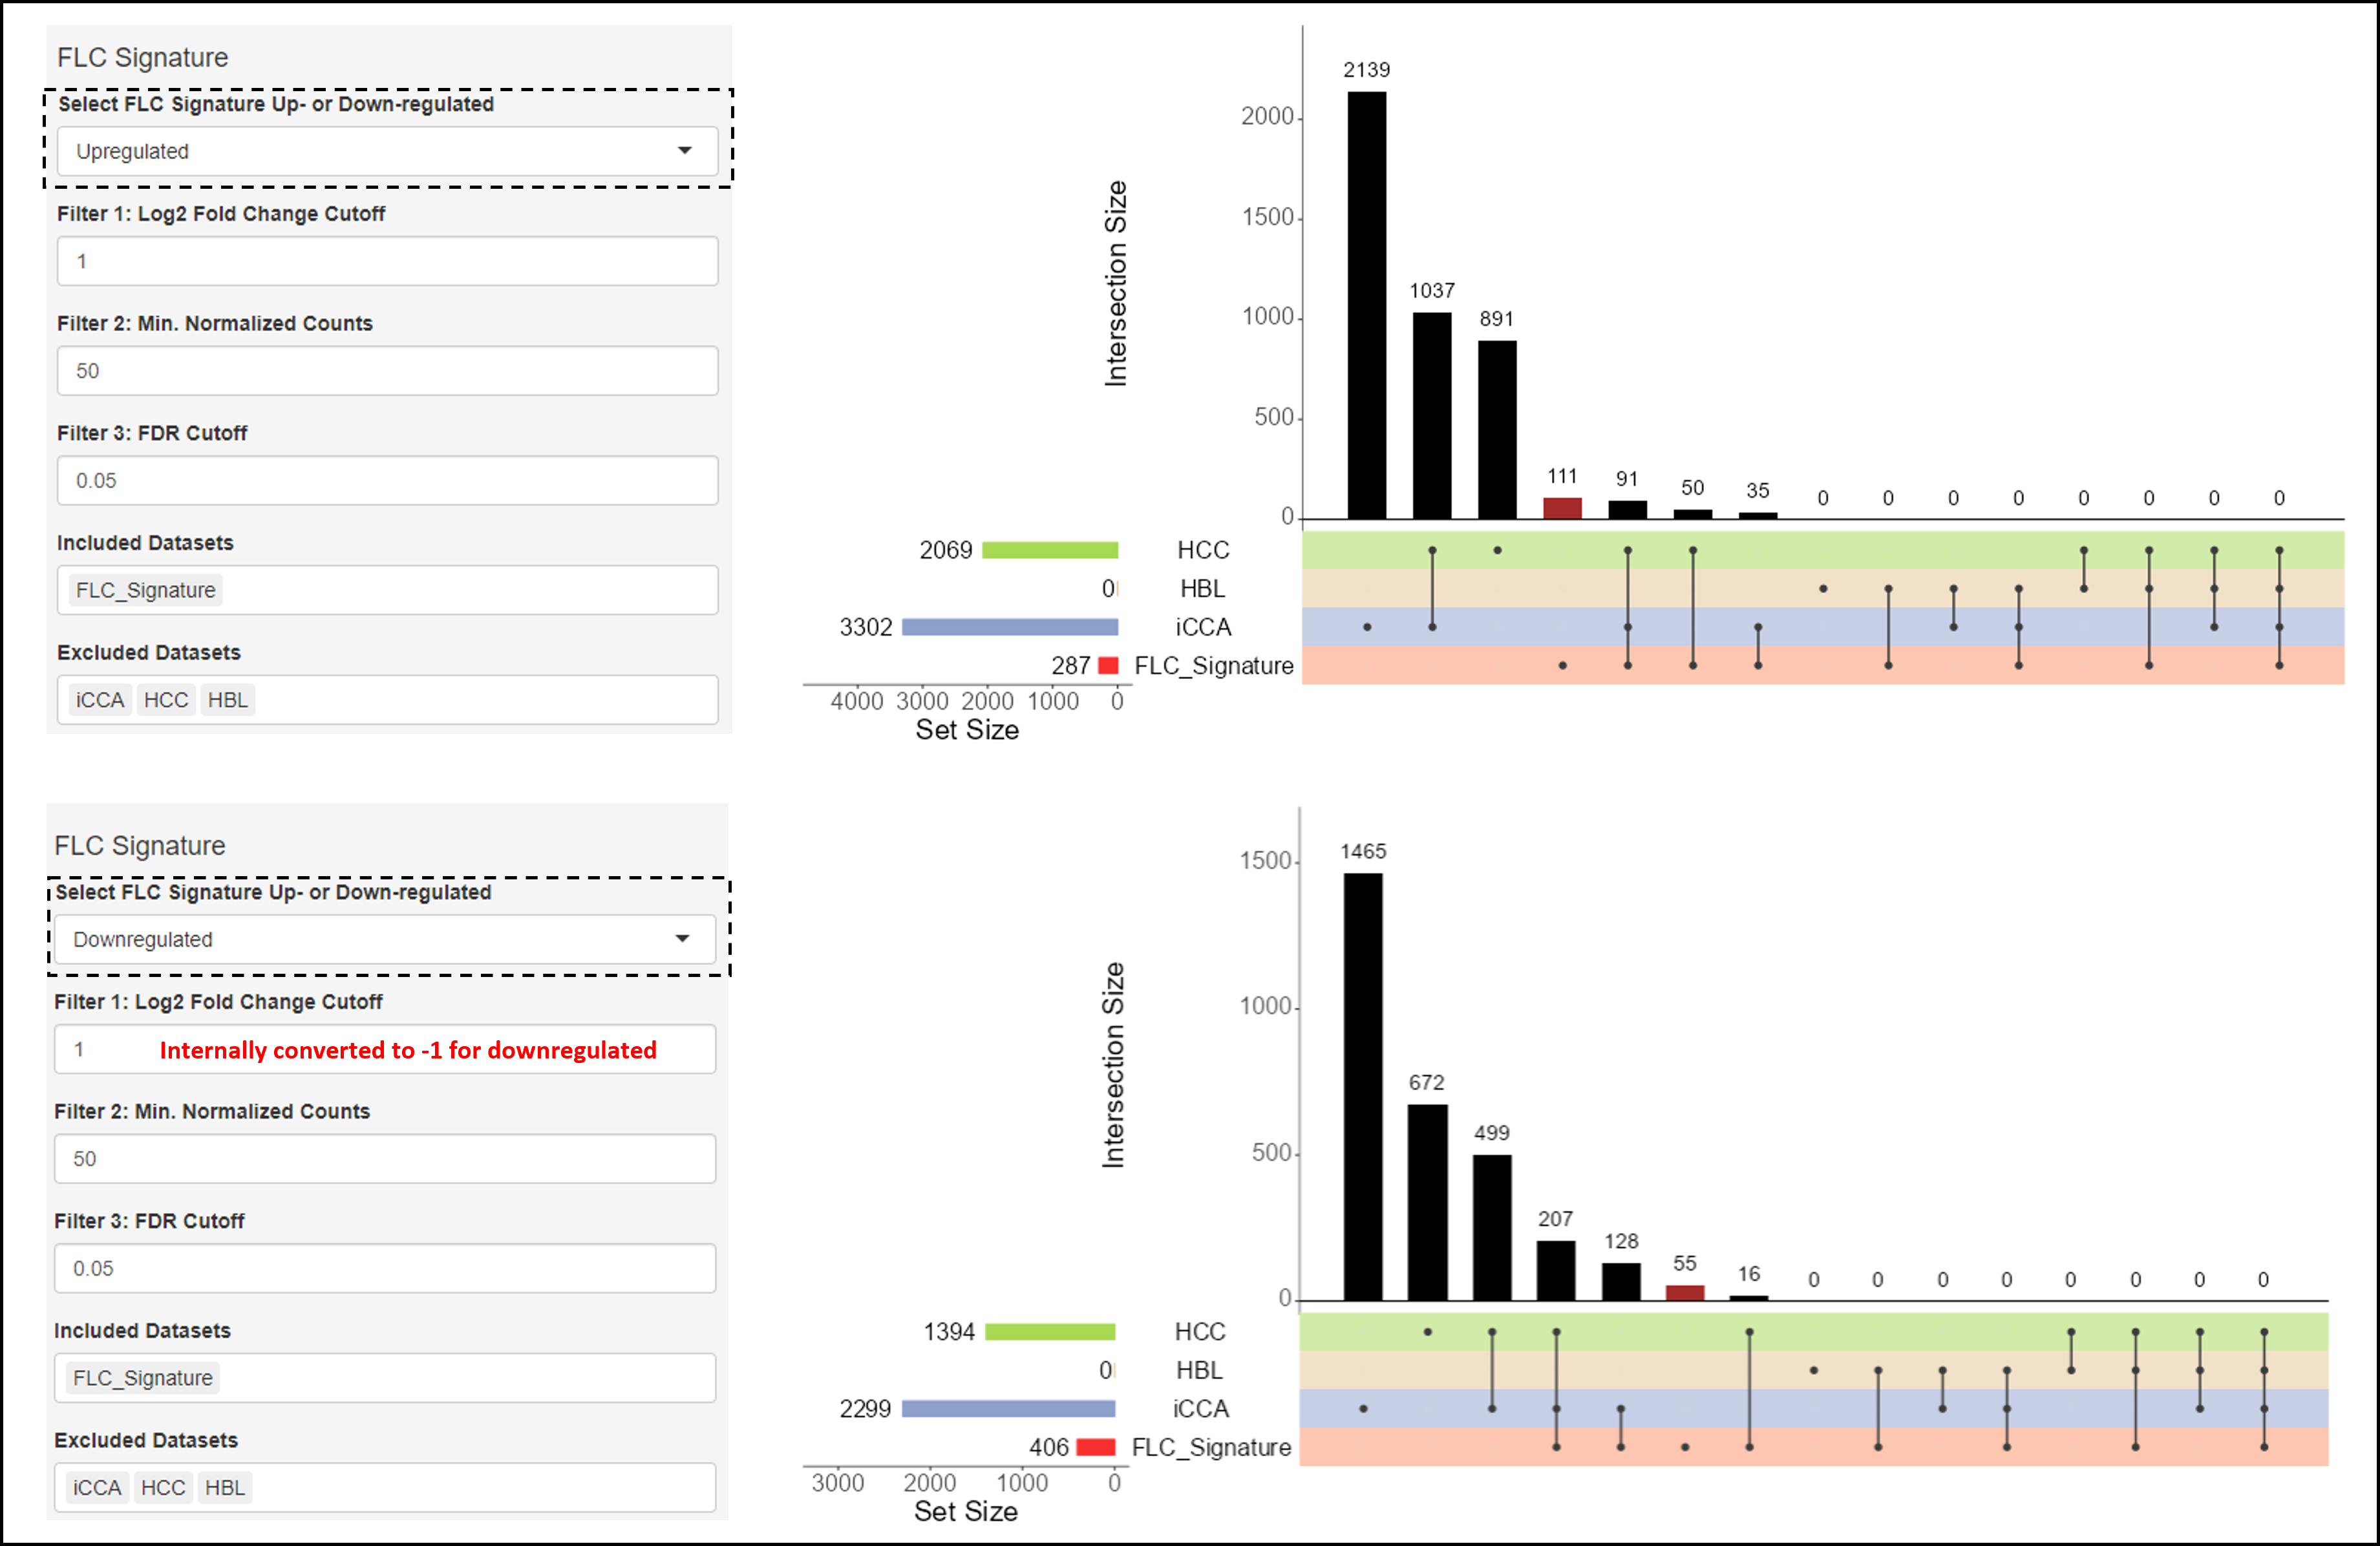
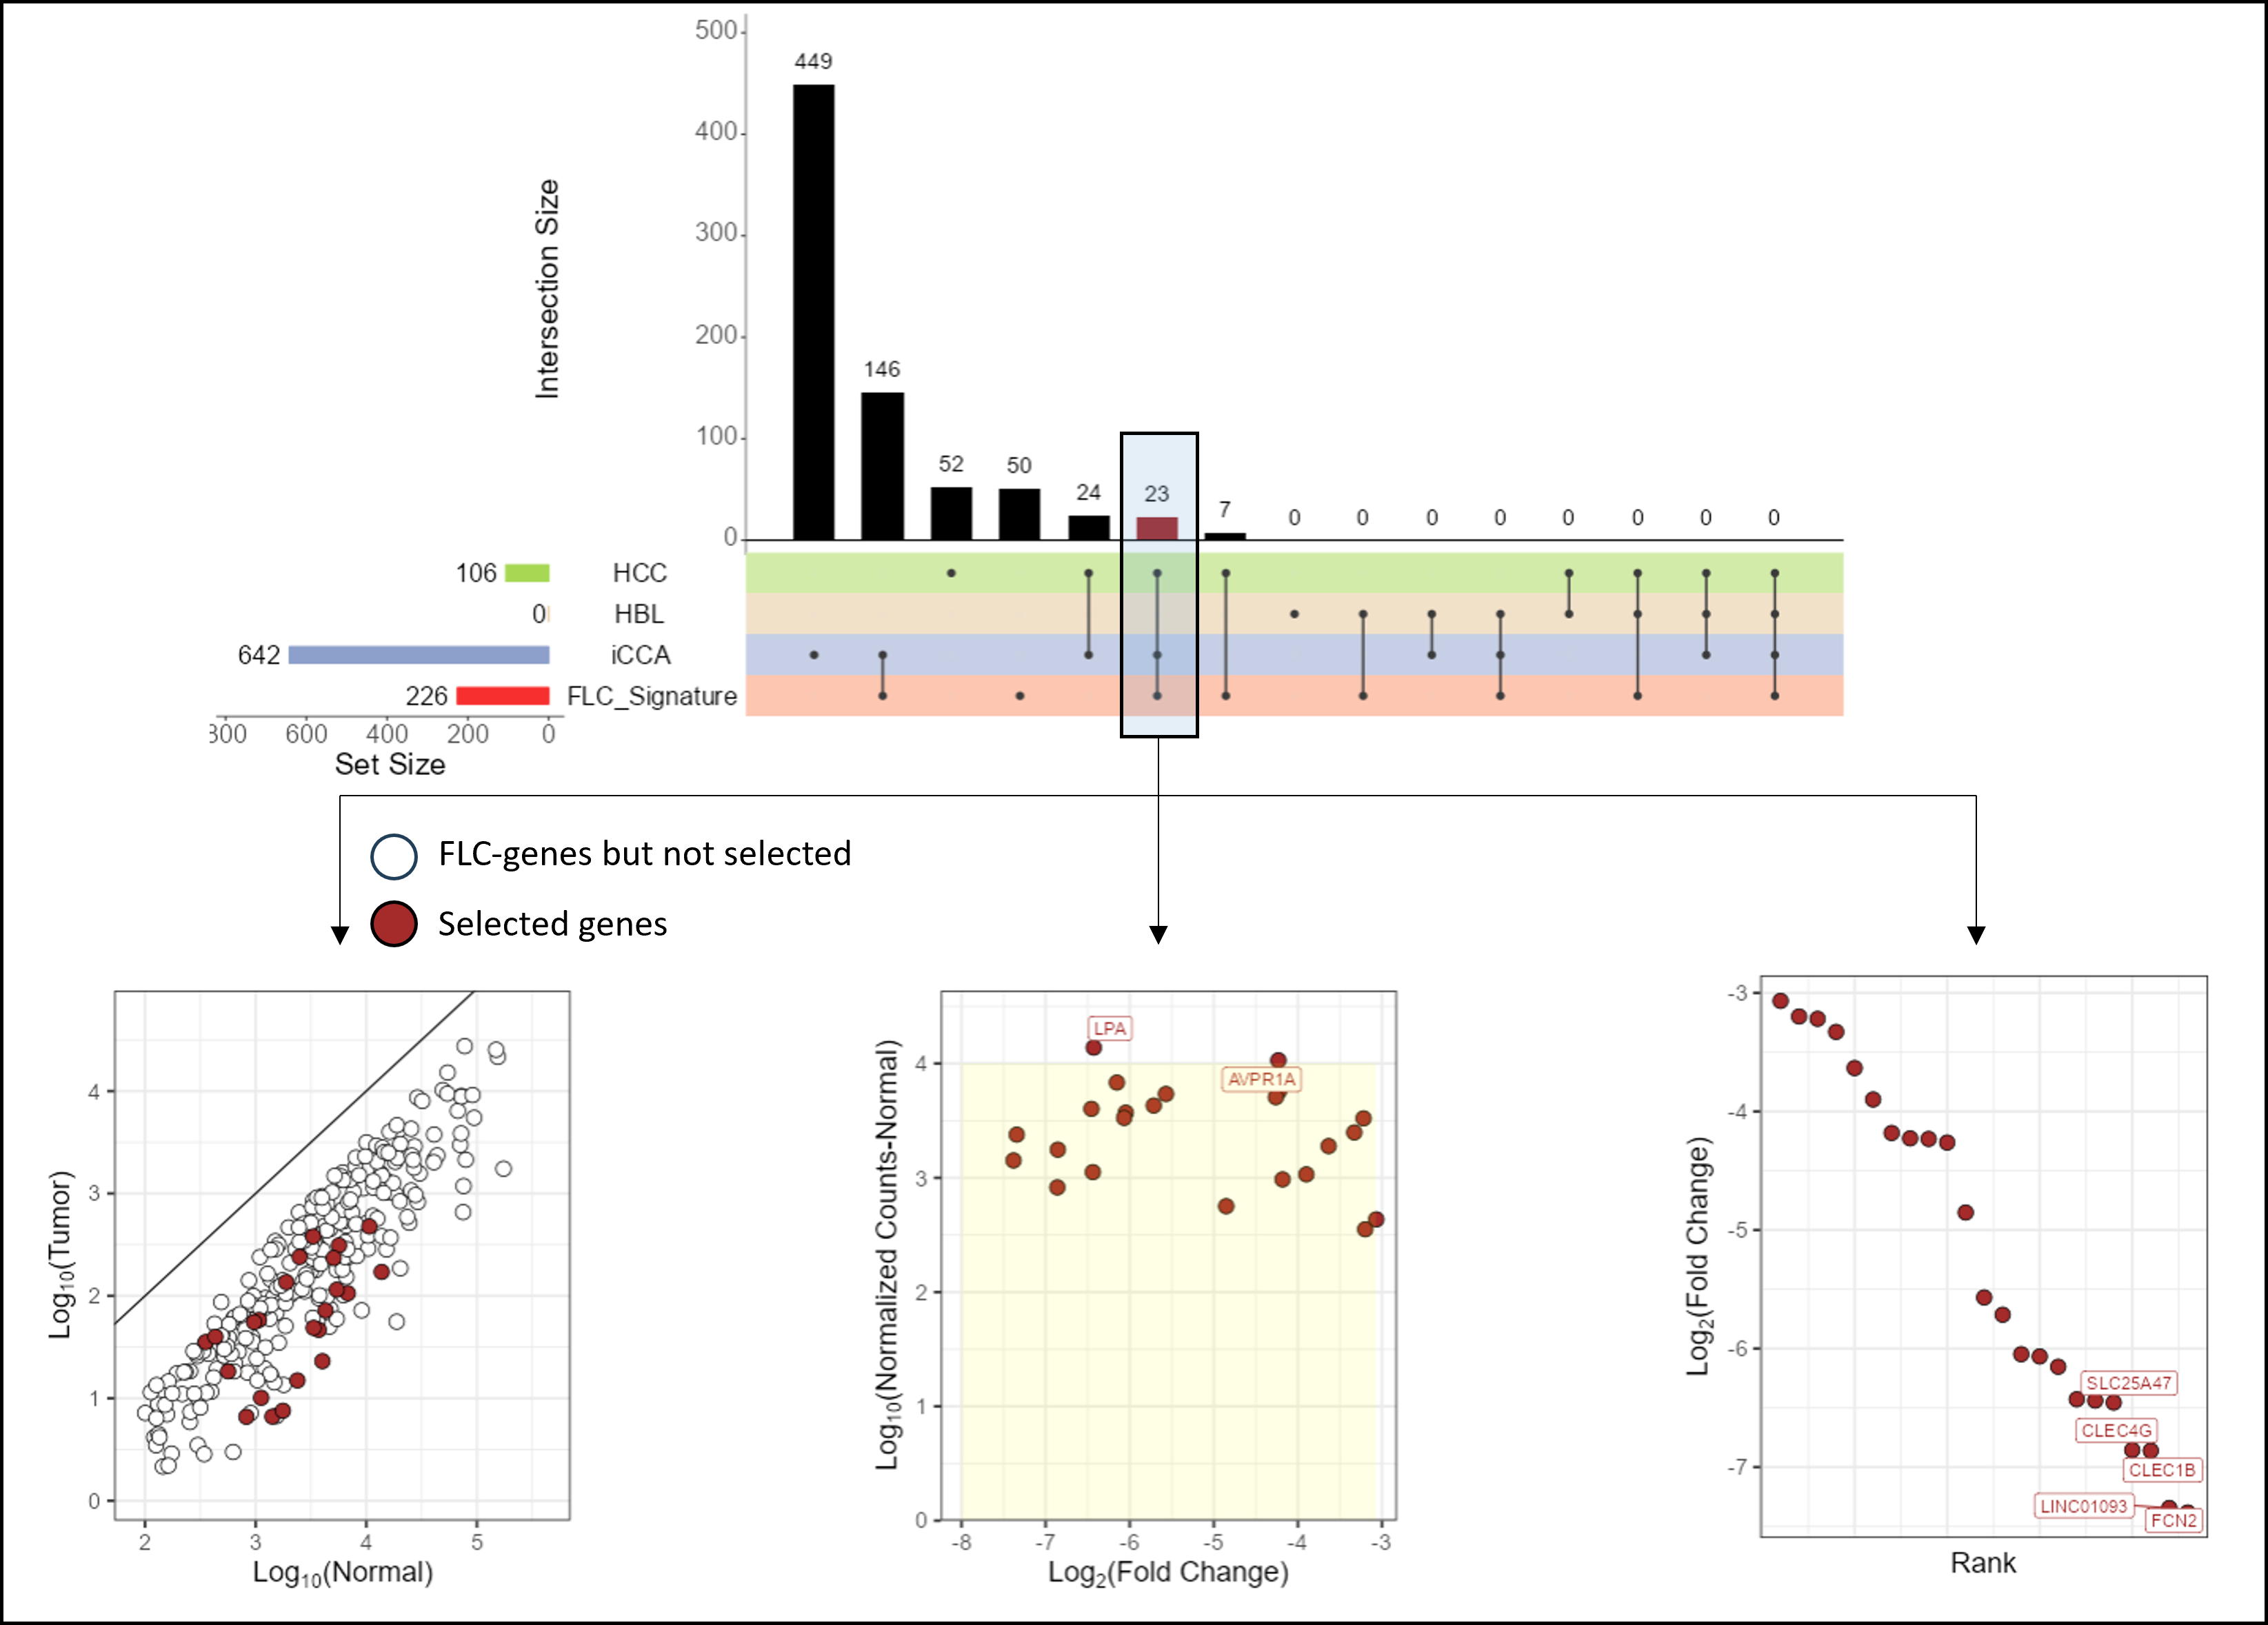
  1. UpSet plot: Shows the intersections between genes that are either up- or downregulated in FLC and other liver cancers, including Intrahepatic Cholangiocarcinoma (iCCA), Hepatocellular Carcinoma (HCC), and Hepatoblastoma (HBL). Users can include and exclude datasets to select an intersection of interest for more detailed analysis in subsequent plots.
  2. Normal vs Tumor Dot Plot (Left): Represents the log10 normalized counts of Normal and Tumor samples for all up- or downregulated FLC genes, highlighting in red the genes corresponding to the set of interest. The diagonal line represents the identity line.
  3. Fold Change vs Counts Dot Plot (Middle): Plots only the selected set of genes and provides information about the log2 Fold Change and log10 Normalized Counts of Tumor samples (for upregulated FLC genes) or Normal samples (for downregulated FLC genes). A yellow box can be specified, and the names of genes outside the box will be displayed.
  4. Rank Plot (Right): The selected set of genes is ordered based on the log2 Fold Change, and the top n genes are labeled depending on the user selection.

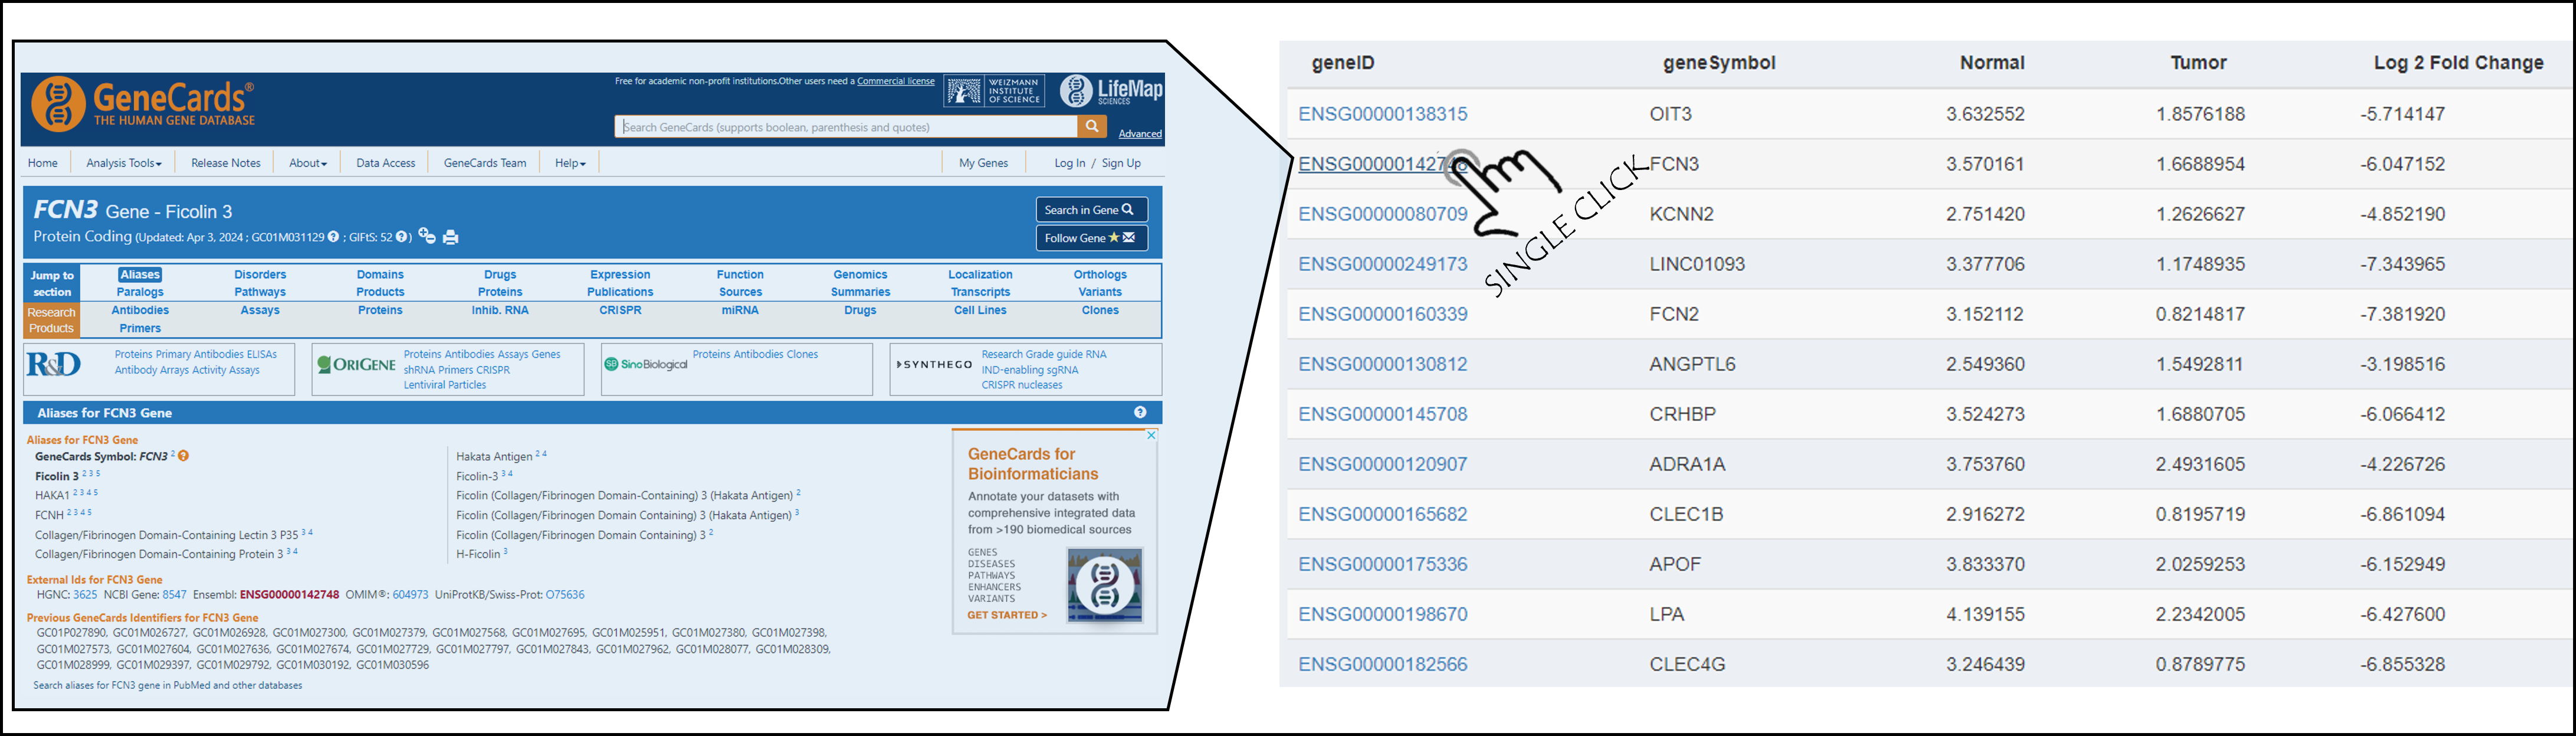
Additionally, this tool generates a table providing the exact Gene ID, gene symbol, normalized counts for Normal and Tumor samples, and log2 Fold Change.

Parameters

  • Select FLC Signature Up- or Downregulated: Allows users to focus on either FLC upregulated genes (287 genes) or downregulated genes (406 genes) and compare this set of genes with other liver cancers.
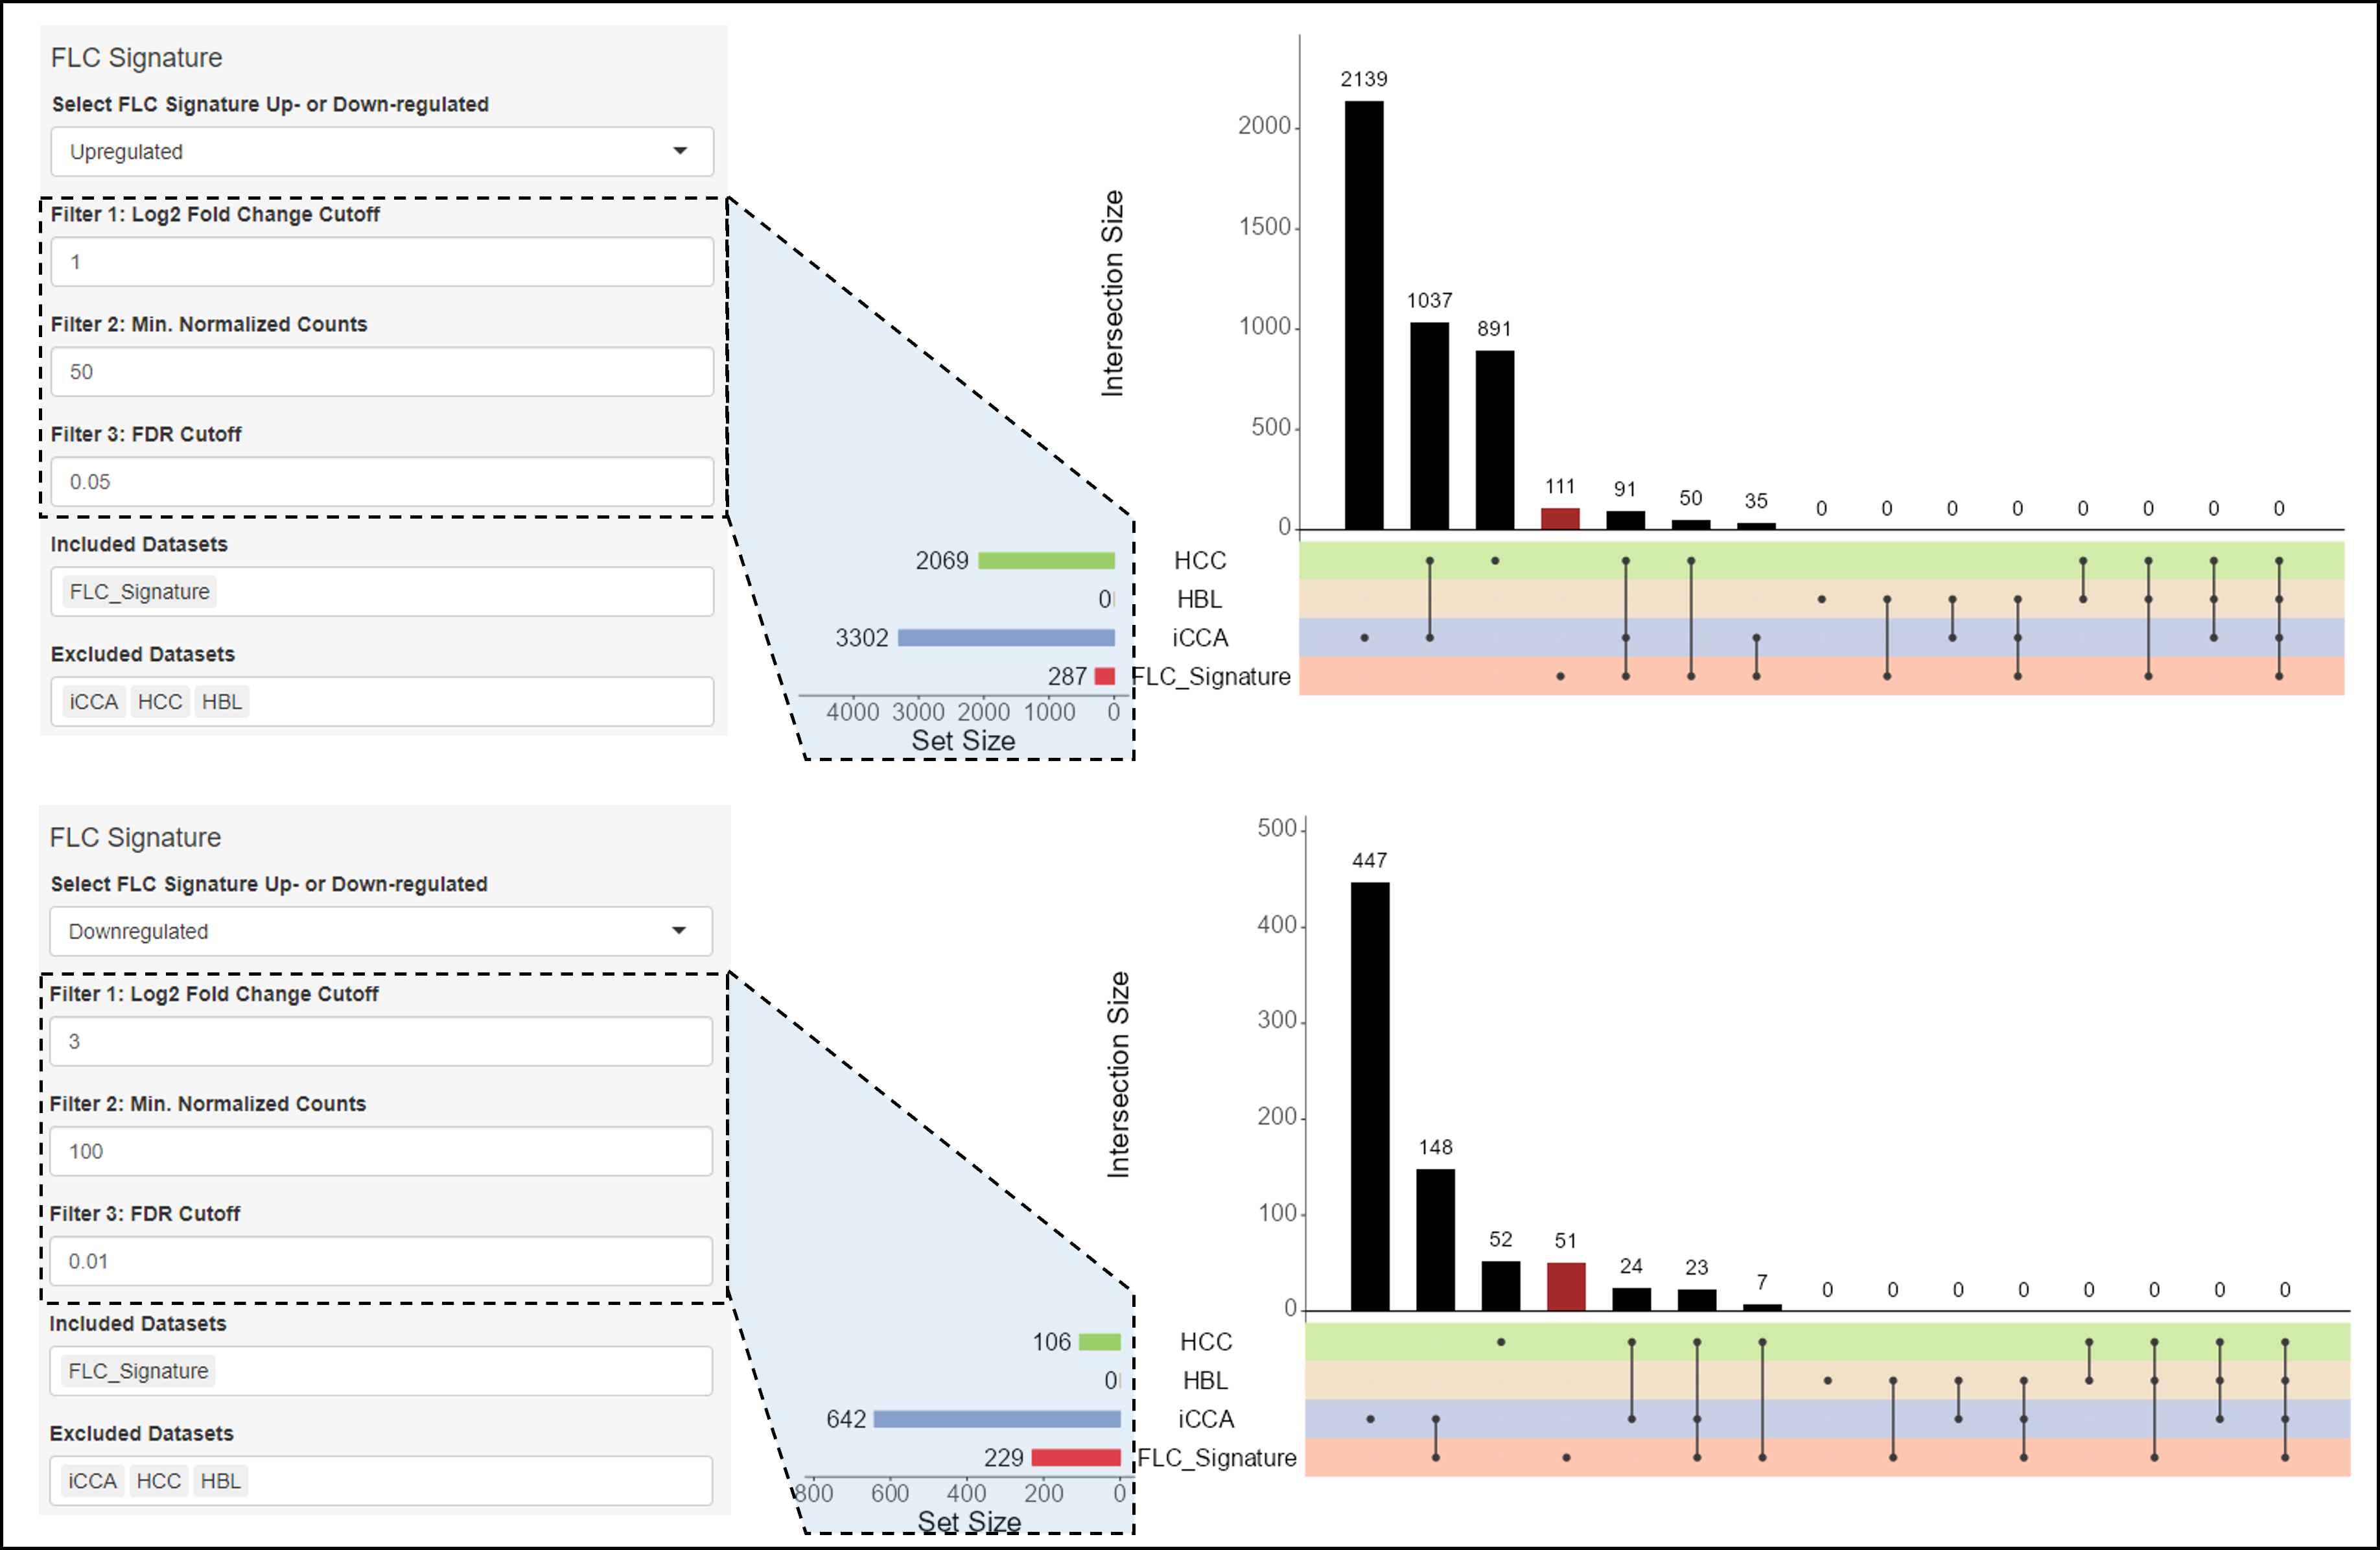
  • Filter 1: Log2 Fold Change Cutoff: This value represents the cutoff for log2 Fold Change used to identify significant genes in each dataset together with the other filters.
  • Filter 2: Min. Normalized Counts: This value represents the minimum normalized counts that a gene should have to be identified as significant in each dataset together with the other filters.
  • Filter 3: FDR Cutoff: Only genes that show an FDR lower than this value and meet the other filters are called significant genes and used for the intersection.
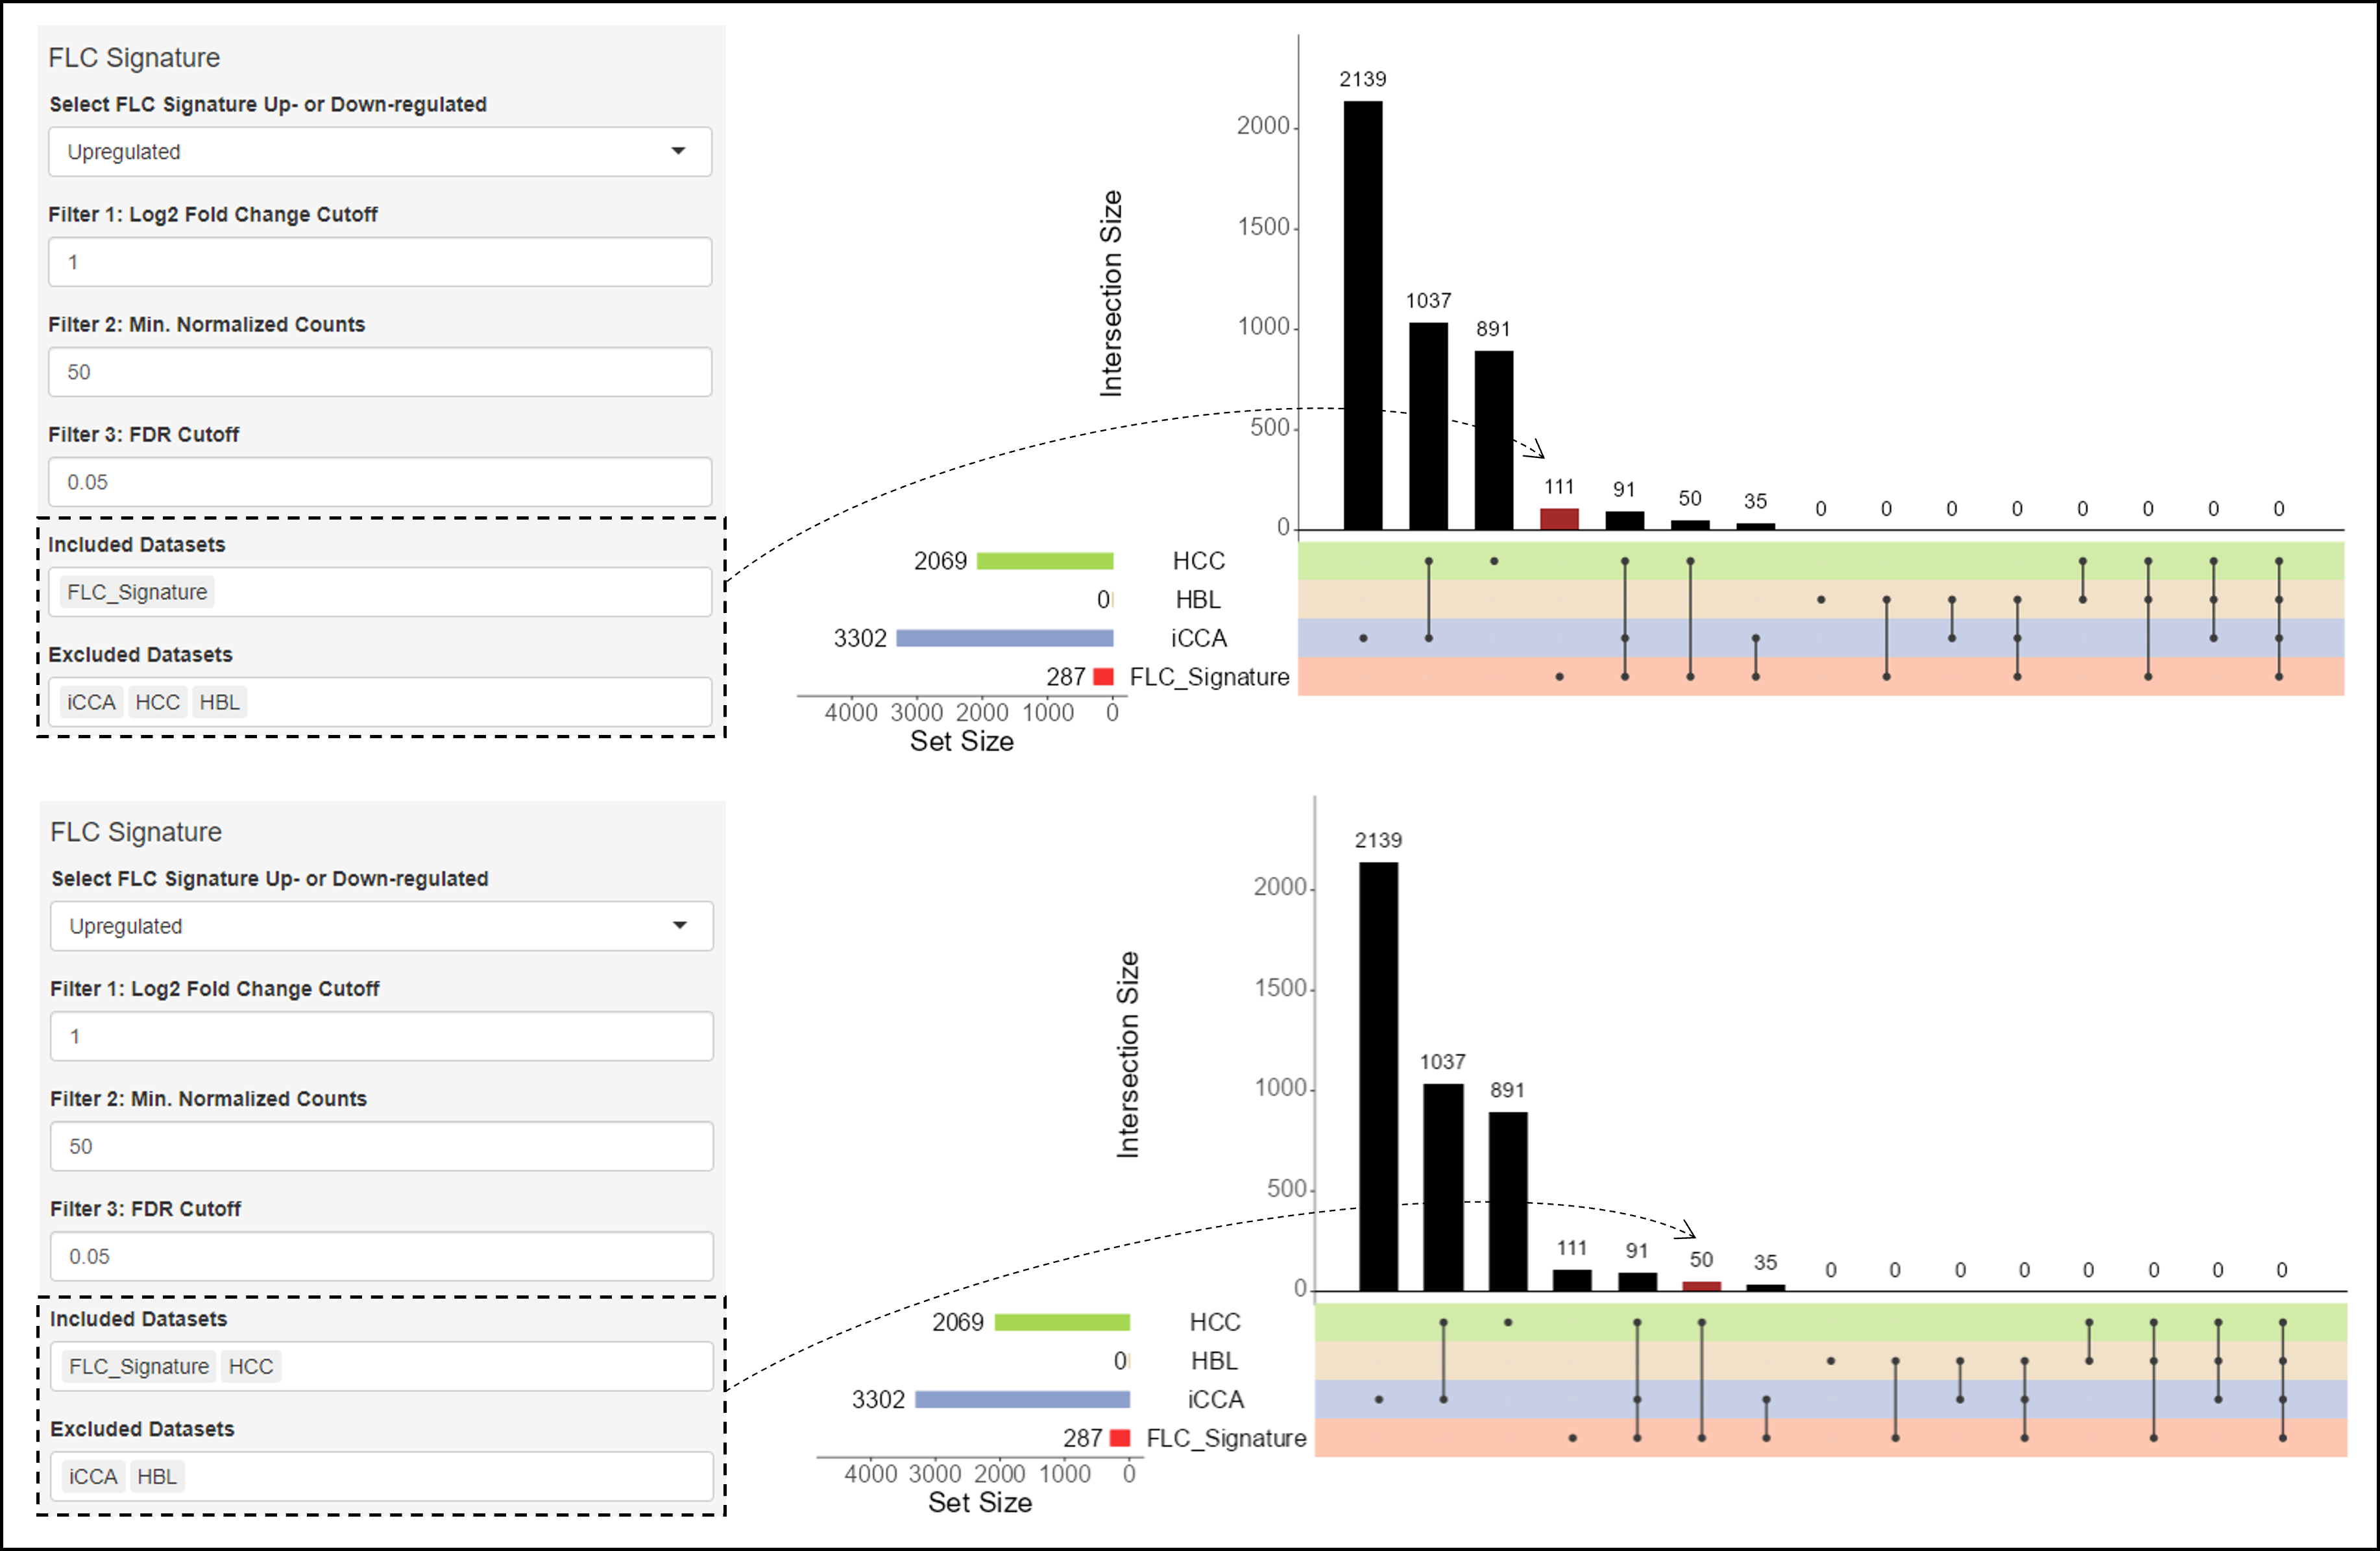
  • Included Datasets: All possible intersections are calculated between FLC and the other liver cancers. However, this parameter allows users to focus on a specific intersection. Users can specify which datasets they want to include in order to select the set of interest.
  • Excluded Datasets: Similar to Included Datasets, users can specify which datasets they want to exclude in order to select the set of interest.
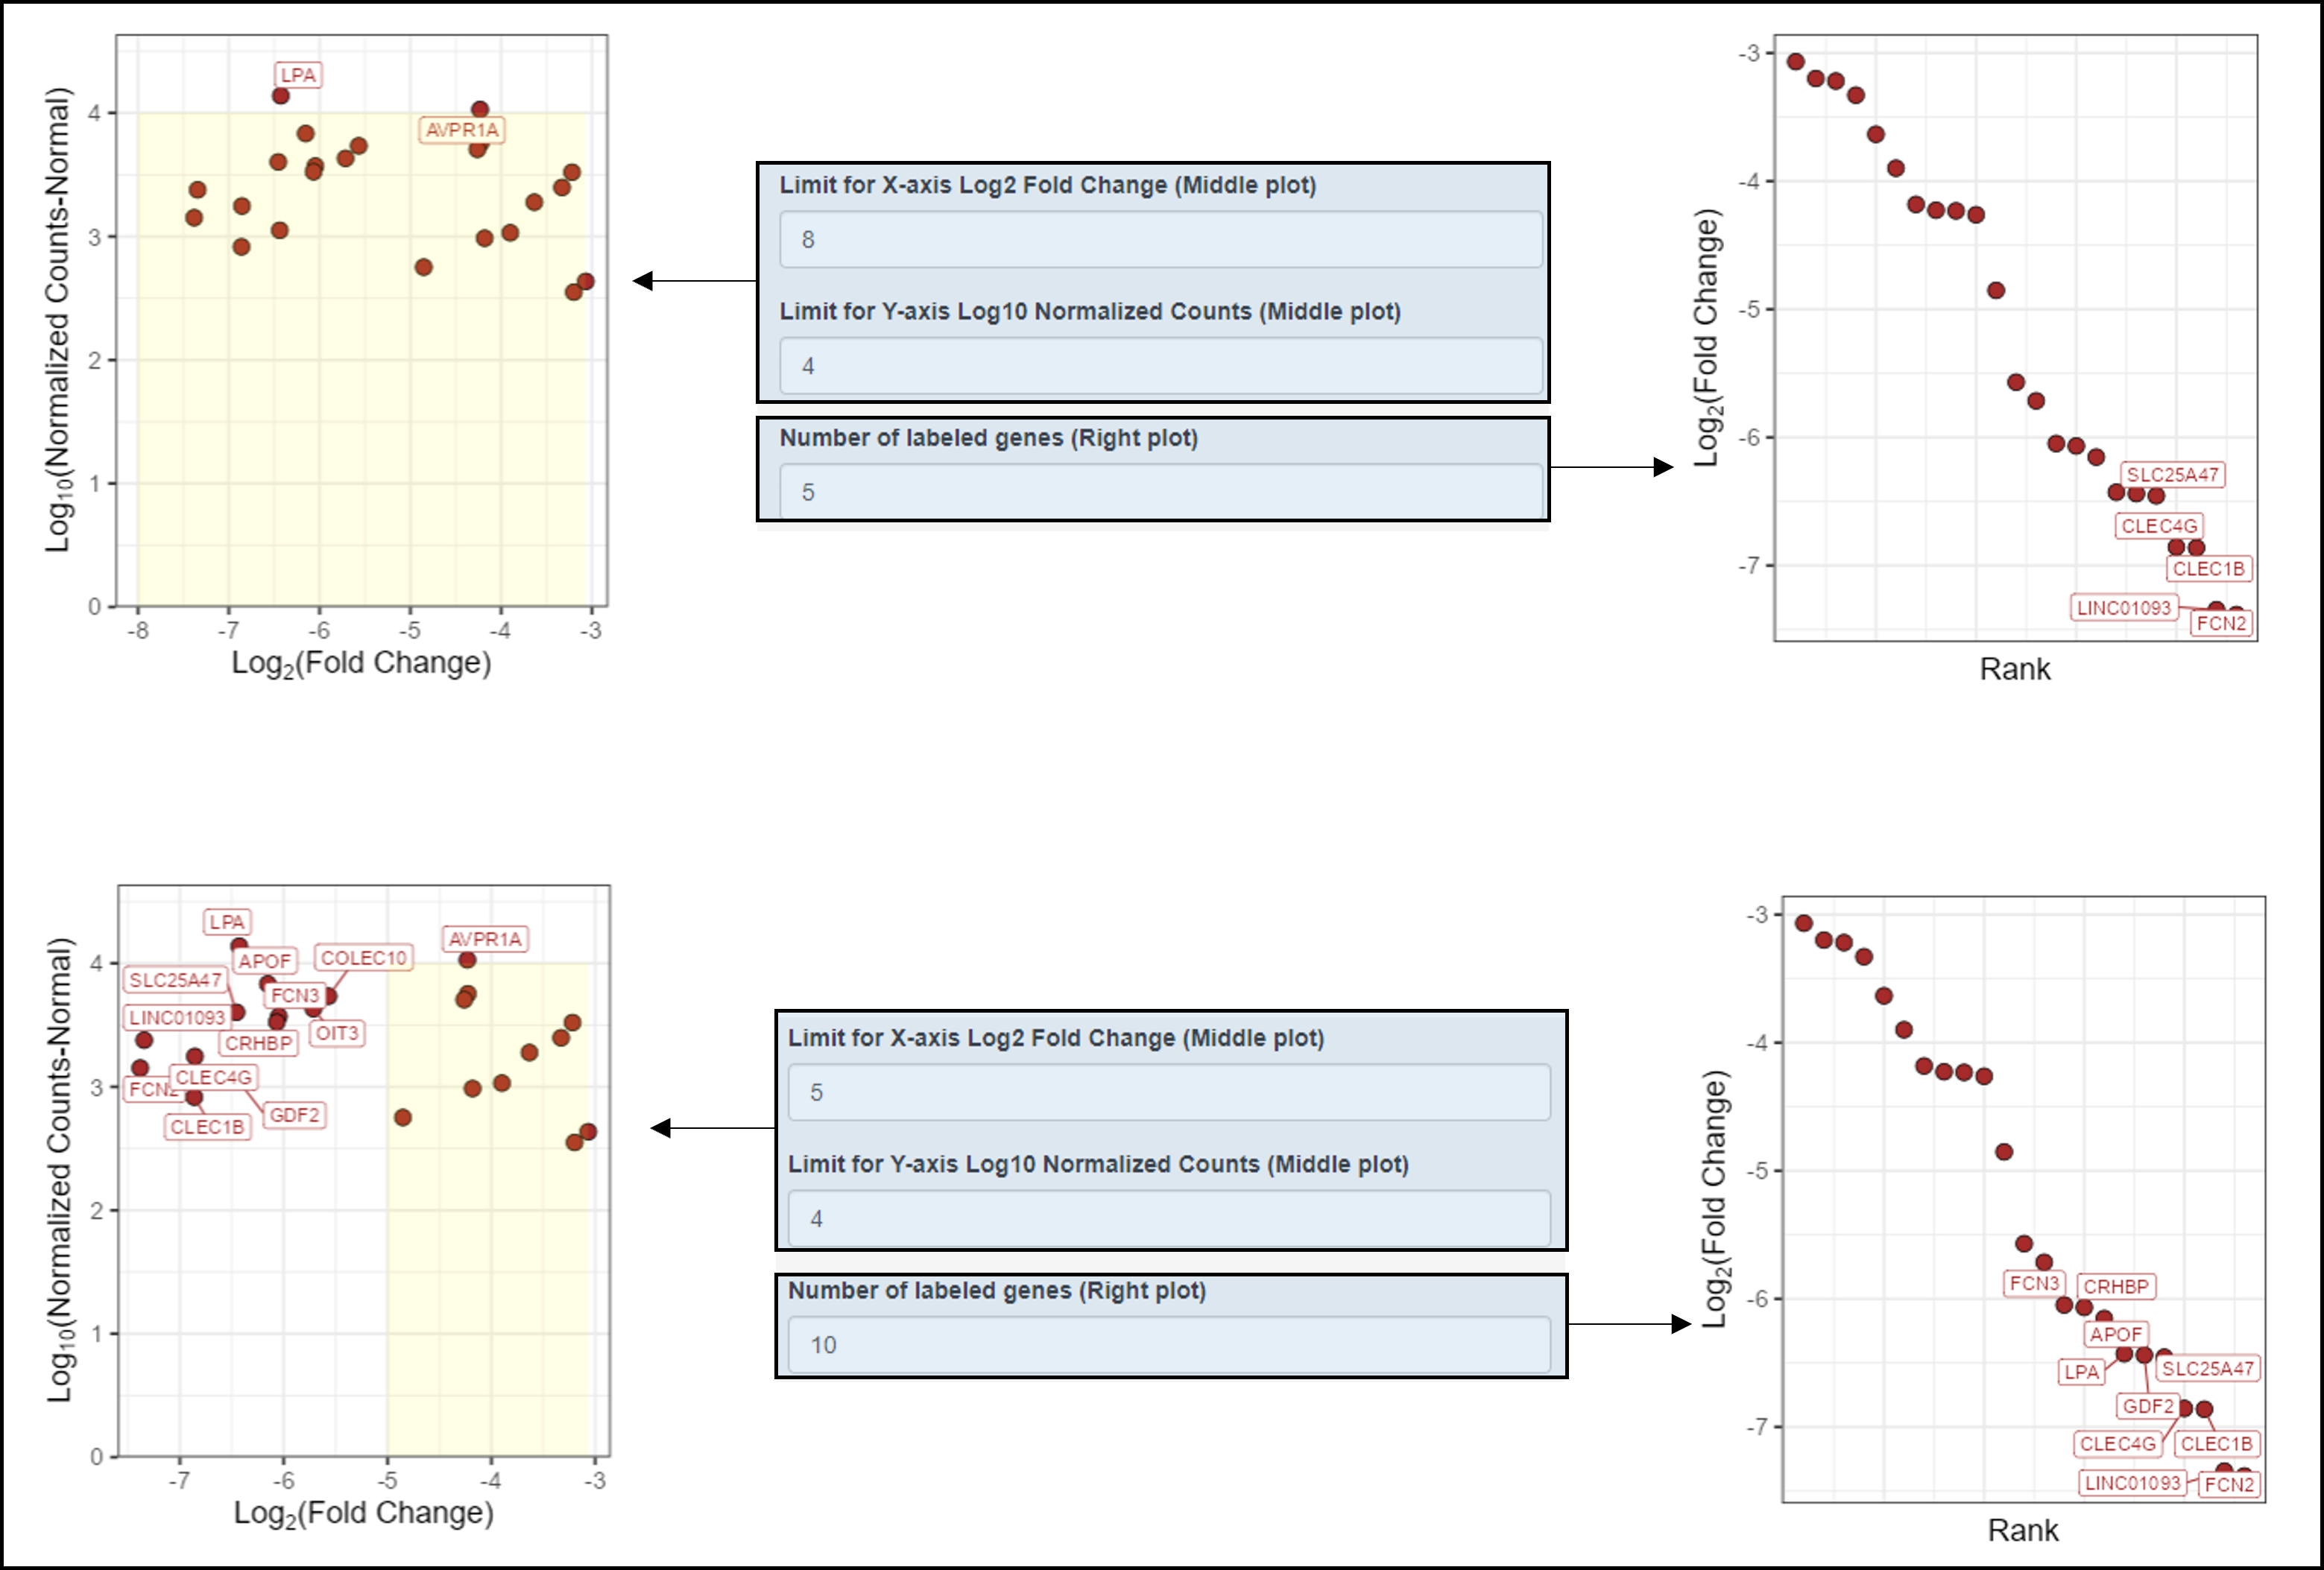
  • Limit for X-axis Log2 Fold Change (Middle Plot): Users can specify a limit for the X-axis, and this value is used to generate a yellow box. All genes outside the yellow box are labeled.
  • Limit for Y-axis Log10 Normalized Counts (Middle Plot): Users can specify a limit for the Y-axis, and this value is used to generate a yellow box. All genes outside the yellow box are labeled.
  • Number of Labeled Genes (Right Plot): In the Rank Plot, users can specify how many top genes they want to label. Genes are ranked by log2 Fold Change.

How to Use This Tool

  • Select FLC Signature: Users need to indicate whether they want to focus on FLC upregulated genes (287 genes) or FLC downregulated genes (406 genes). Based on this choice, the tool will focus on the intersections of these genes with genes differentially expressed in other liver cancers.
  • Specify Filters: Users need to specify three filters to identify a gene as a differentially expressed gene (DEG):
    • Log2 Fold Change Cutoff: For upregulated genes, the positive value of this number will be used as the cutoff. For downregulated genes, the negative value of this number will be used as the cutoff.
    • Min. Normalized Counts: This parameter is relevant for users who want to focus on highly expressed genes, for example. While log2 Fold Change provides information about how much the expression of a gene differs between two conditions, it is also important to know whether that gene is highly expressed. When upregulated genes are selected, Min. Normalized Counts is applied to the Tumor samples; when downregulated genes are selected, Min. Normalized Counts is applied to the Normal samples.
    • FDR Cutoff: Significant genes are generally identified using an FDR of 0.05; however, this is a statistical convention, and there are no rigorous biological constraints. Therefore, we encourage users to select more stringent (<0.01) or more flexible (<0.1) cutoffs.
  • Select Datasets: Once all filters are specified, the tool will calculate the intersections between the FLC upregulated or downregulated genes and all significant genes from the other cancers. Users can then select which datasets they want to include and exclude in order to define a gene set of interest. For example:
    • If users are interested in genes that are specific to FLC and not significant in other cancers, the selection would be:

      Included datasets: FLC_Signature
      Excluded datasets: iCCA HCC HBL

    • If users are interested in the set of FLC genes that are significant in HCC but not significant in iCCA or HBL, the selection would be:

      Included datasets: FLC_Signature HCC
      Excluded datasets: iCCA HBL

  • Analyze the Plots:
    • UpSet Plot: The selected set of interest is highlighted in red, but other combinations are also shown. The Y-axis indicates the number of genes in each possible intersection. Each intersection is represented by dots connected by lines. The horizontal bar plot on the left represents the total number of significant genes in each dataset.
    • Normal vs Tumor Dot Plot (Left): Shows all FLC genes while highlighting the genes corresponding to the set of interest in red.
    • Fold Change vs Counts Dot Plot (Middle): Shows only the genes corresponding to the set of interest. Users can also define a yellow box to hide gene labels within a specified region. Only genes outside the yellow box will be labeled.
    • Rank Plot (Right): Shows all genes ranked by log2 Fold Change. Users can specify the number of top genes to be labeled.
  • Review the Table: A table is shown with information about the genes corresponding to the set of interest, as well as hyperlinks to the GeneCards database.

Genomics

Mutations in FLC Signature

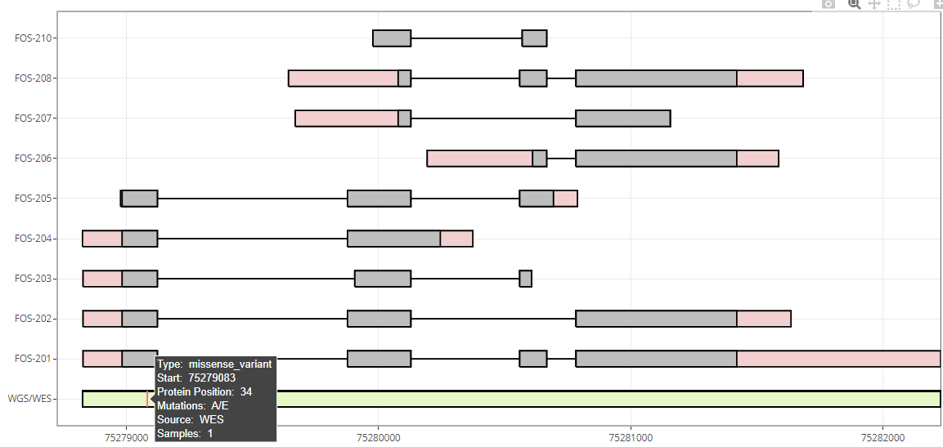
In this section, we aggregate Whole Exome Sequencing (WES) and Whole Genome Sequencing (WGS) data to identify mutations associated with Fibrolamellar Carcinoma (FLC) from both FLC tumor and normal samples. This tool provides a comprehensive visualization of multiple isoforms for each gene and the mutations identified in our analyses.

Parameters

  • Human Gene: Users can input an HGNC symbol or an ENSG code for any gene. The input is case-insensitive and does not depend on the gene version. If the gene is not found in our dataset, a warning message will be displayed.
  • Transcript Type: This tool allows users to plot all isoforms or only protein-coding isoforms. Users can choose based on their interests and the specific requirements of their analysis.

Detailed Interaction Features

Plot Representation

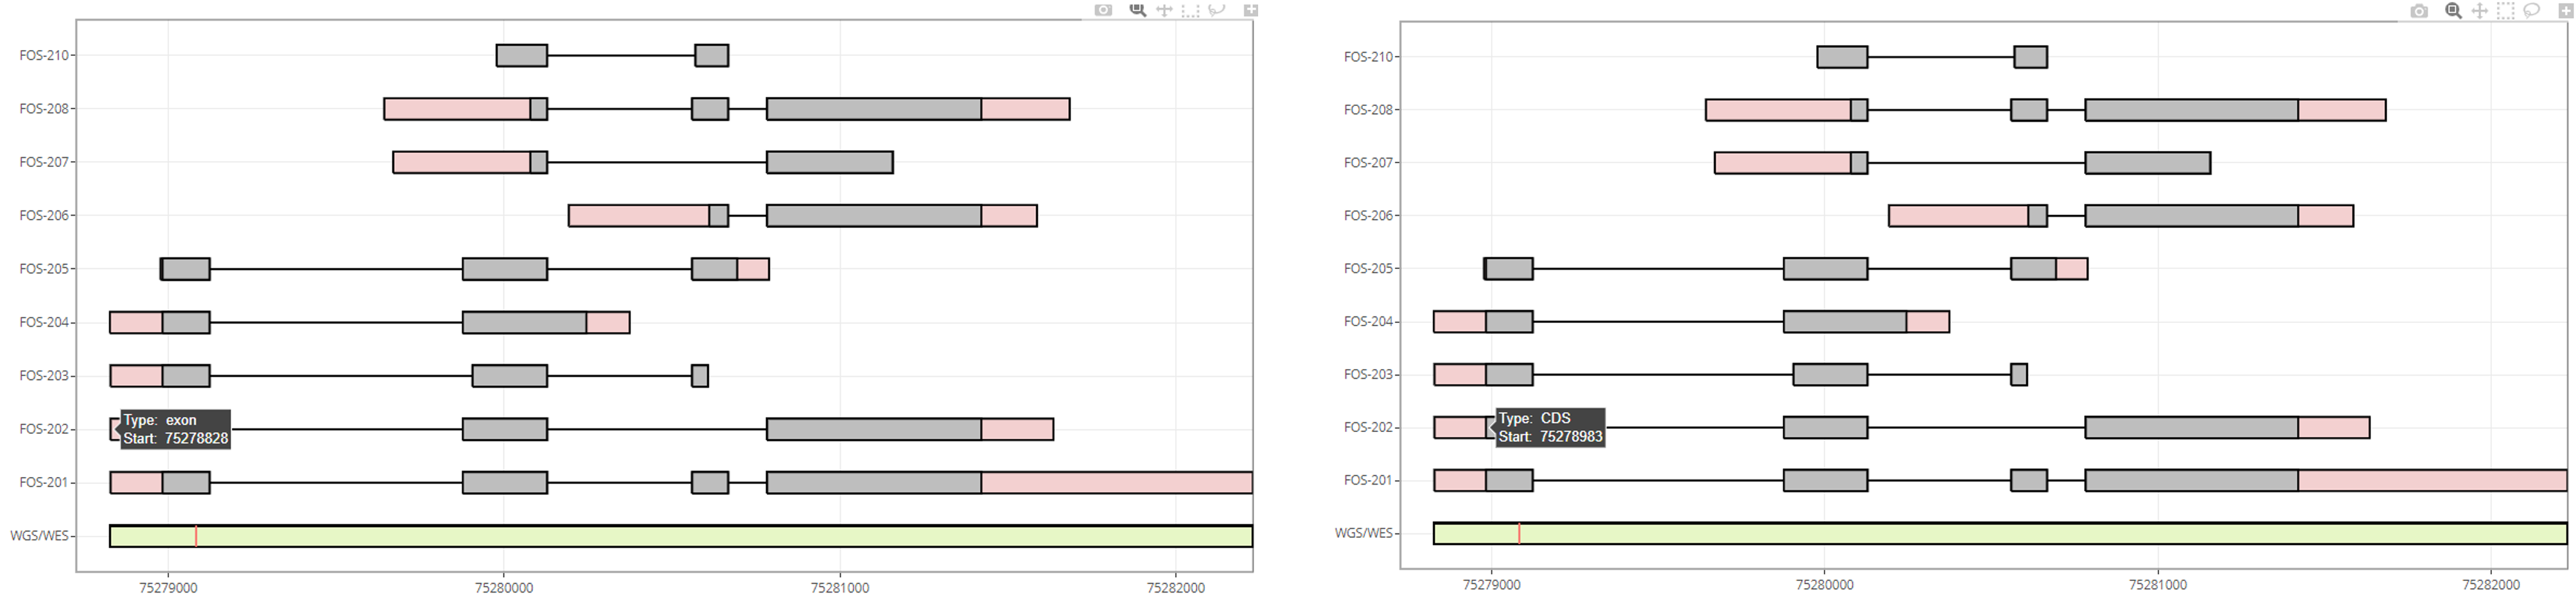
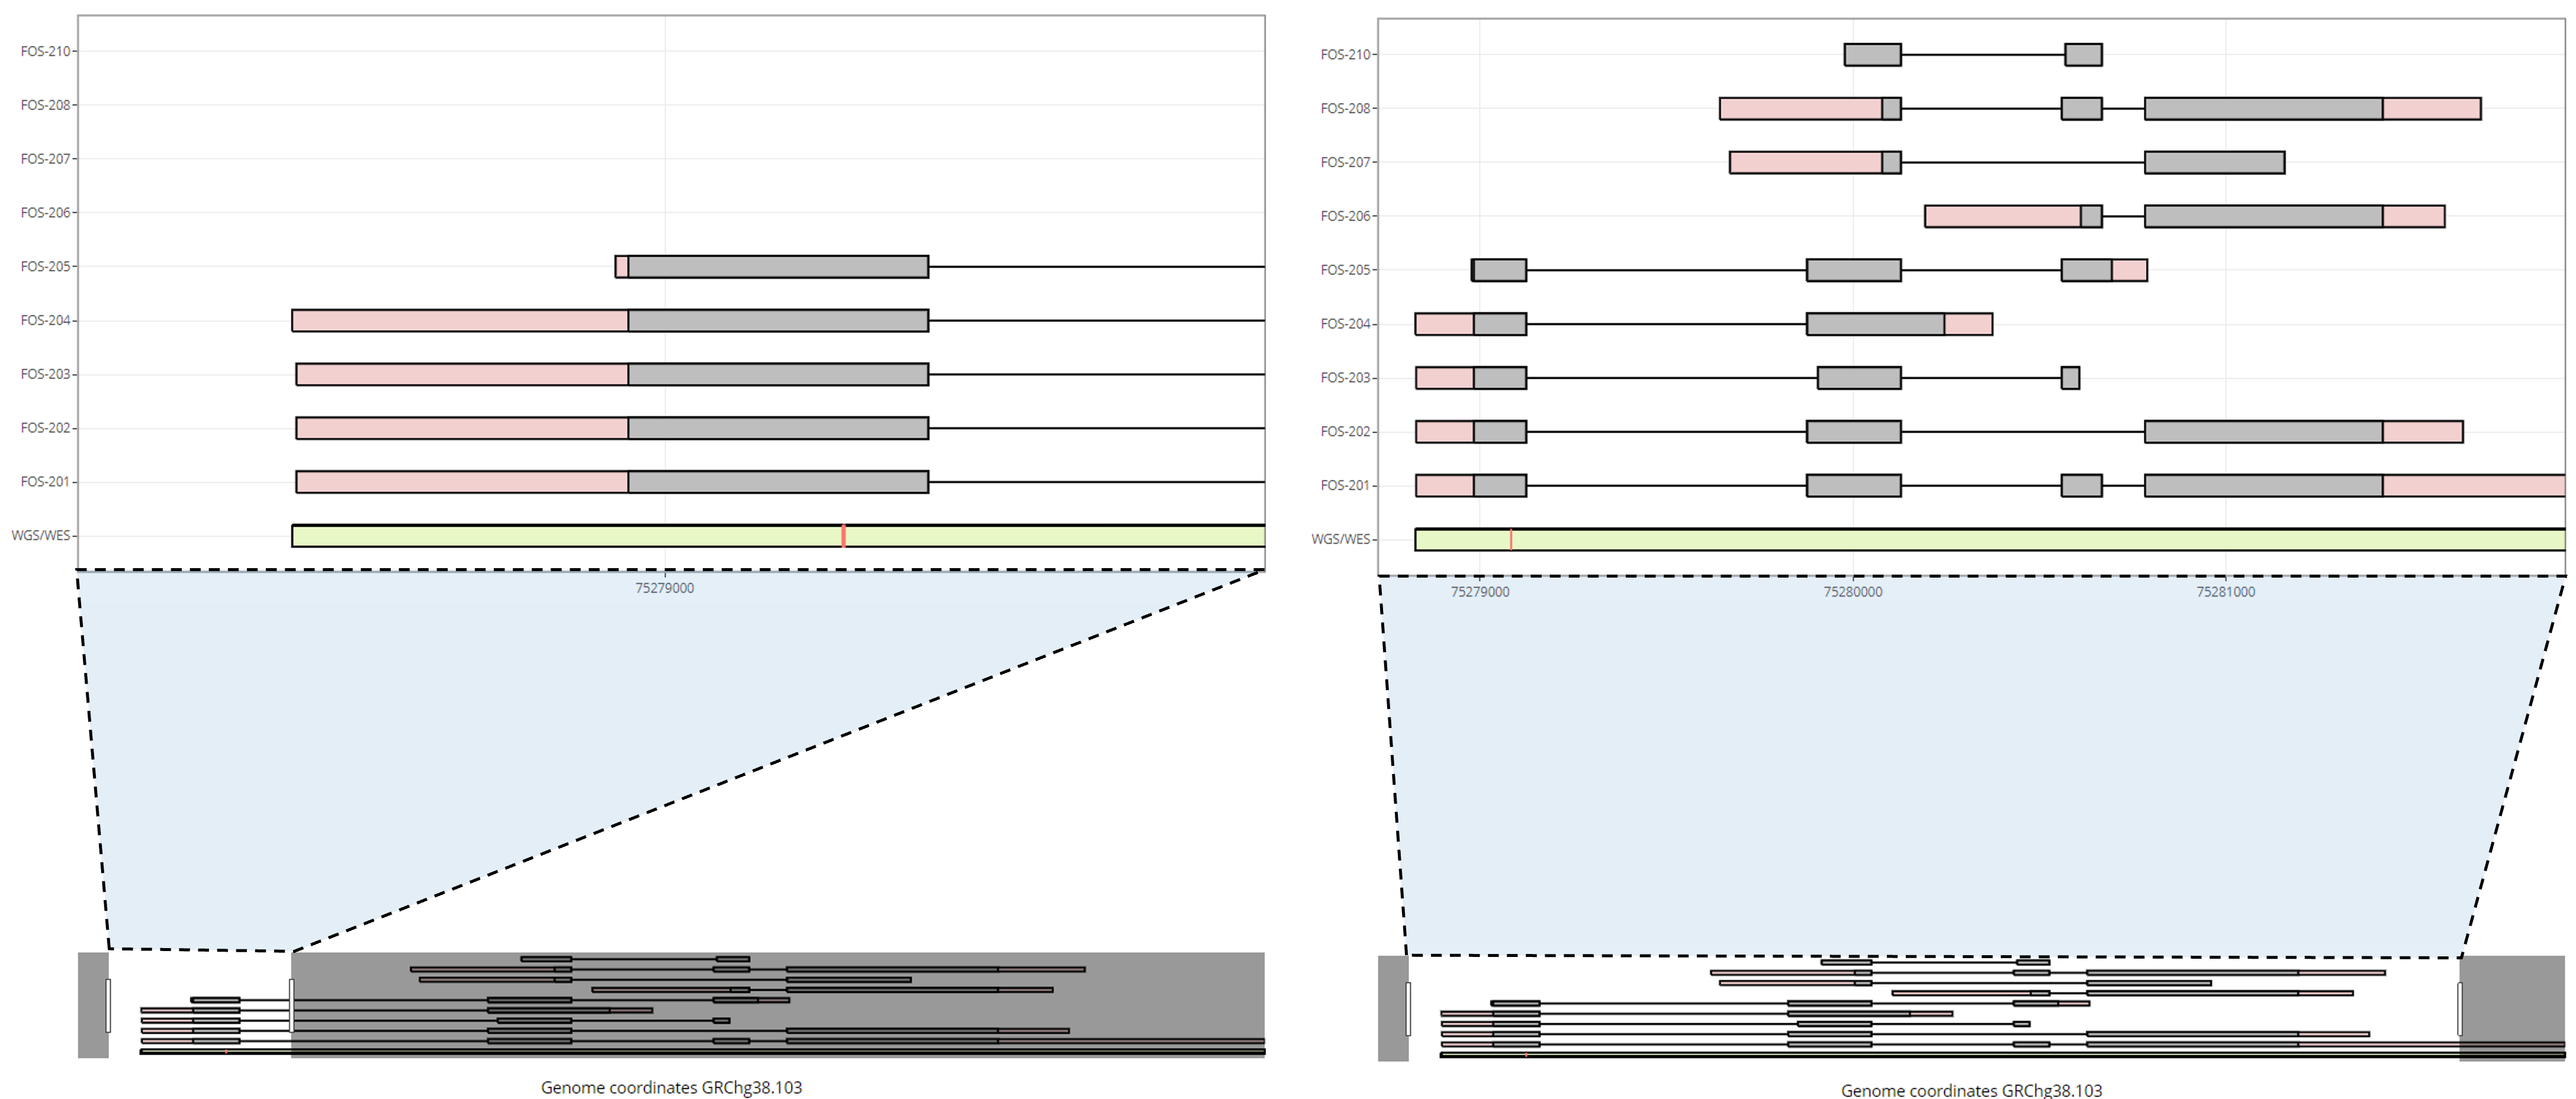
  • Isoform Visualization: The plot generates a representation of each isoform using genomic coordinates from the GRCh38.103 genome version. Each isoform is represented as a set of exons and introns, as well as CDS (Coding DNA Sequence) regions for protein-coding isoforms. This detailed visualization helps users understand the structural complexity and variation among the isoforms of each gene.

Interactive Elements

  • Hover Information: When users hover over a region of the plot, a tooltip appears displaying additional information about the exact coordinates of the element (e.g., exon or CDS). This feature provides immediate and precise details about the gene structure.
  • Zooming and Focusing: Below the plot, there is a slider bar that users can move to zoom in on a region of interest or zoom out to see all isoforms within the same region. This functionality allows users to focus on specific areas of the gene or obtain a broader overview as needed.

Additional Features

  • Summary Table: Like the previous tools, this section generates a summary table showing detailed information about the mutations and their corresponding sites. This table includes the mutation type, location, and potential impact, providing a comprehensive overview of the genetic variations identified.

Example Usage

  1. Input a Gene: Enter an HGNC symbol or an ENSG code for the gene you are interested in. For example, you might enter TP53 or ENSG00000141510.
  2. Select Transcript Type: Choose whether to view all isoforms or only protein-coding isoforms. This option helps tailor the visualization to your specific research needs.
  3. Generate Plot: After entering the gene and selecting the transcript type, click on the appropriate button to generate the plot. The plot will appear, showing the isoforms and their detailed structures.
  4. Interact with the Plot: Hover over different regions to see detailed coordinates and use the slider to zoom in or out. This interaction allows for a deeper exploration of the gene’s structure.
  5. Review Summary Table: Scroll down to see the summary table with information about identified mutations. This table provides a detailed list of genetic variations and their characteristics.

Multiomics

Here we provide different ways to explore FLC by integrating multiple layers of molecular and clinical information. In addition to changes in RNA expression and DNA mutations, FLC can be studied through changes in protein abundance, DNA methylation, and their relationships with the transcriptome and genome. Clinical information can also be integrated with these molecular data to investigate their relationship with patient outcomes.

When you move to the Multiomics tab, you will see four different subtabs:

  • Protein Expression
  • DNA Methylation
  • Multiomics Integration
  • Survival Analysis

Protein Expression allows you to explore protein abundance in FLC using proteomic data generated by both label-free quantification (LFQ) and tandem mass tag (TMT) mass spectrometry.

DNA Methylation allows you to explore DNA methylation patterns measured using targeted bisulfite sequencing.

Multiomics Integration brings together different types of molecular information to provide a more complete view of FLC. These analyses allow you to explore how changes in genes, RNA, proteins, and DNA methylation relate to each other and contribute to the molecular characteristics of FLC.

Survival Analysis allows you to explore patient survival data from Berkovitz et al., 2022 and its relationship with clinical and molecular features.

The following sections describe how to use each of these analyses.

Protein Expression

In Progress.

Multiomics

DNA Methylation

In Progress.

Multiomics

Multiomics Integration

In Progress.

Multiomics

Survival Analysis

In Progress.

FLC transcripts in subtypes of liver cancers

FLC transcripts in subtypes of liver cancers (Normal, Tumor)

Loading...
Download Plot

FLC transcripts from different cancer subtypes

FLC transcripts from different cancer subtypes (Normal, Primary, Recurrence, Metastasis)

Loading...
Download Plot

FLC Transcripts from different labs

FLC Transcripts from different labs (Normal, Tumor)

Loading...
Download Plot

Multi-Faceted Gene Expression Plots from FLC and Hepatic Cancers

Loading...

Differential expressed genes from FLC in selected set

WGS/WES mutations interactive plot

Loading...

Summary Table for identified mutations

In Preparation

Articles

Please cite our multi-omics manuscript:
Liver cancer multiomics reveals diverse protein kinase A disruptions convergently produce fibrolamellar hepatocellular carcinoma.
Requena D., et al. (2024). Nature Communications 15:10887. https://doi.org/10.1038/s41467-024-55238-2

In this study, we analyzed these samples using state-of-the-art bioinformatic tools and calculated transcriptomic signatures for each liver cancer, unrestricted by experimental processing methods. We showed that FLC is characterized by PKA activation caused by different mutations. These have been observed in tumors harboring:

  • The chimeric fusion of the genes DNAJB1 and PRKACA in hepatocytes.
  • The chimeric fusion of the genes ATP1B1 and PRKACA in cholangiocytes.
  • Missing activity of the R1 regulatory subunit of PKA (PRKAR1A) in hepatocytes.

Developer team

The current version has been upgraded and is maintained by David Requena and Daniel F. Guevara Diaz, part of BigMind.

In the initial version of this website, the content was developed by David Requena, Jack A. Medico, and Sanford M. Simon, while the web interface was created by Luis F. Soto-Ugaldi.

The plots generated in this web application can be reproduced in R using the functions provided in the OmicsKit library (GitHub), which can be installed by executing the following line of code:

remotes::install_github(repo = "BigMindLab/OmicsKit")